
Impact of Land Use Change on Water Yield Using the SWAT Model in the Minraleng Sub-Watershed, Maros

Abstract
One of the factors that influence the hydrological dynamics of a watershed is land use change, especially those related to water yield and river flow stability. The purpose of this research is to evaluate the impact of land use changes during the period 2018–2023 on water production and the River Regime Coefficient (RRC) in the Minraleng Sub-Watershed, Upper Walanae Watershed. Land cover change analysis was conducted using Sentinel-2 images from 2018 and 2023, while hydrological response was analyzed using the standard Soil and Water Assessment Tool (SWAT) model with inputs of climate, soil, topography, and land use data. Research results show that during the period 2018–2023, there was a decrease in mixed dryland agriculture, followed by an increase in secondary dryland forests and rice fields. SWAT simulations show that an increase in annual rainfall is followed by an increase in surface runoff, average discharge, and maximum discharge, while minimum discharge experiences a significant decrease. The condition of the watershed indicates that the ability to maintain base flow during the dry season has decreased. The value of the River Regime Coefficient (RRC) increased as a result of greater surface runoff, indicating an increase in river discharge variation between the rainy and dry seasons. The validation results based on community interviews show that the simulation model results are aligned. The hydrological stability of the Minraleng Sub-Watershed tends to decrease due to land-use changes and increased rainfall.
1. Introduction
Land-use change such as deforestation, agricultural expansion, and the opening of cultivation areas have caused significant changes to the hydrological cycle. The reduction of vegetation cover decreases soil infiltration capacity and increases surface runoff, thereby triggering more extreme streamflow fluctuations in the form of floods during the rainy season and droughts during the dry season (Cai et al., 2021; Naha et al., 2021). Hydrological changes are further exacerbated by climate change, which intensifies extreme weather events and affects the spatial and temporal distribution of water resources. The impact of land-use changes on hydrology tends to be more complex due to the high dependence of local communities on land and water resources to meet daily needs (van Emmerik et al., 2014). Watersheds function as an ecological system that provides essential ecosystem services, such as water supply, erosion control, and support for agricultural activities (Dharmawan et al., 2023). Forest cover degradation in upstream watersheds reduces soil water storage capacity, increases surface runoff, elevates erosion risk, and decreases water availability during the dry season (Mekonnen & Hoekstra, 2020; Peña-Arancibia et al., 2019).
The Minraleng Sub-Watershed in Maros Regency is part of the upstream Walanae Watershed, which is designated as one of Indonesia’s priority watersheds and has experienced intensive land-use change in recent years (Firdazam et al., 2023; Tajuddin et al., 2018). The upstream waters include features varied topography, ranging from lowlands to mountainous terrain, with dominant land uses including mixed dryland agriculture, rainfed paddy fields, shrubs, and secondary forest (Pemkab Maros, 2021). These land-use changes are suspected to affect regional water balance, particularly water yield, infiltration capacity, surface runoff, and streamflow stability (Zhang et al., 2020). Water regulation disturbances are reinforced by relatively steep slopes in the upstream watershed, which may increase surface flow and erosion when vegetation cover declines. The intensification of agricultural activities and land utilization without optimal application of soil and water conservation practices can accelerate watershed degradation and reduce land capacity to store and regulate water sustainably.
The SWAT model can simulate hydrological processes spatially and temporally by integrating climate, soil, topography, and land-use data, making it suitable for analyzing changes in water yield, surface runoff, infiltration, evapotranspiration, and streamflow in a watershed (Ware et al., 2024). Numerous studies have shown that land-use change significantly influences watershed hydrological response, particularly in tropical regions characterized by high rainfall and intensive land-use pressures (Paiva et al., 2023; Ware et al., 2024). Most previous studies have focused on streamflow or erosion analysis without explicitly linking land-cover dynamics, water yield, and water regime stability, especially in the Minraleng Sub-Watershed. This study was conducted to analyze the impact of land-use change on water yield and the River Regime Coefficient (RRC) in the Minraleng Sub-Watershedusing the SWAT model for the 2018–2023 period. The findings are expected to provide scientific insights into the relationship between land-use change and watershed hydrological dynamics as a basis for sustainable watershed management in the Upper Walanae Watershed.
2. Method
1) Study Area
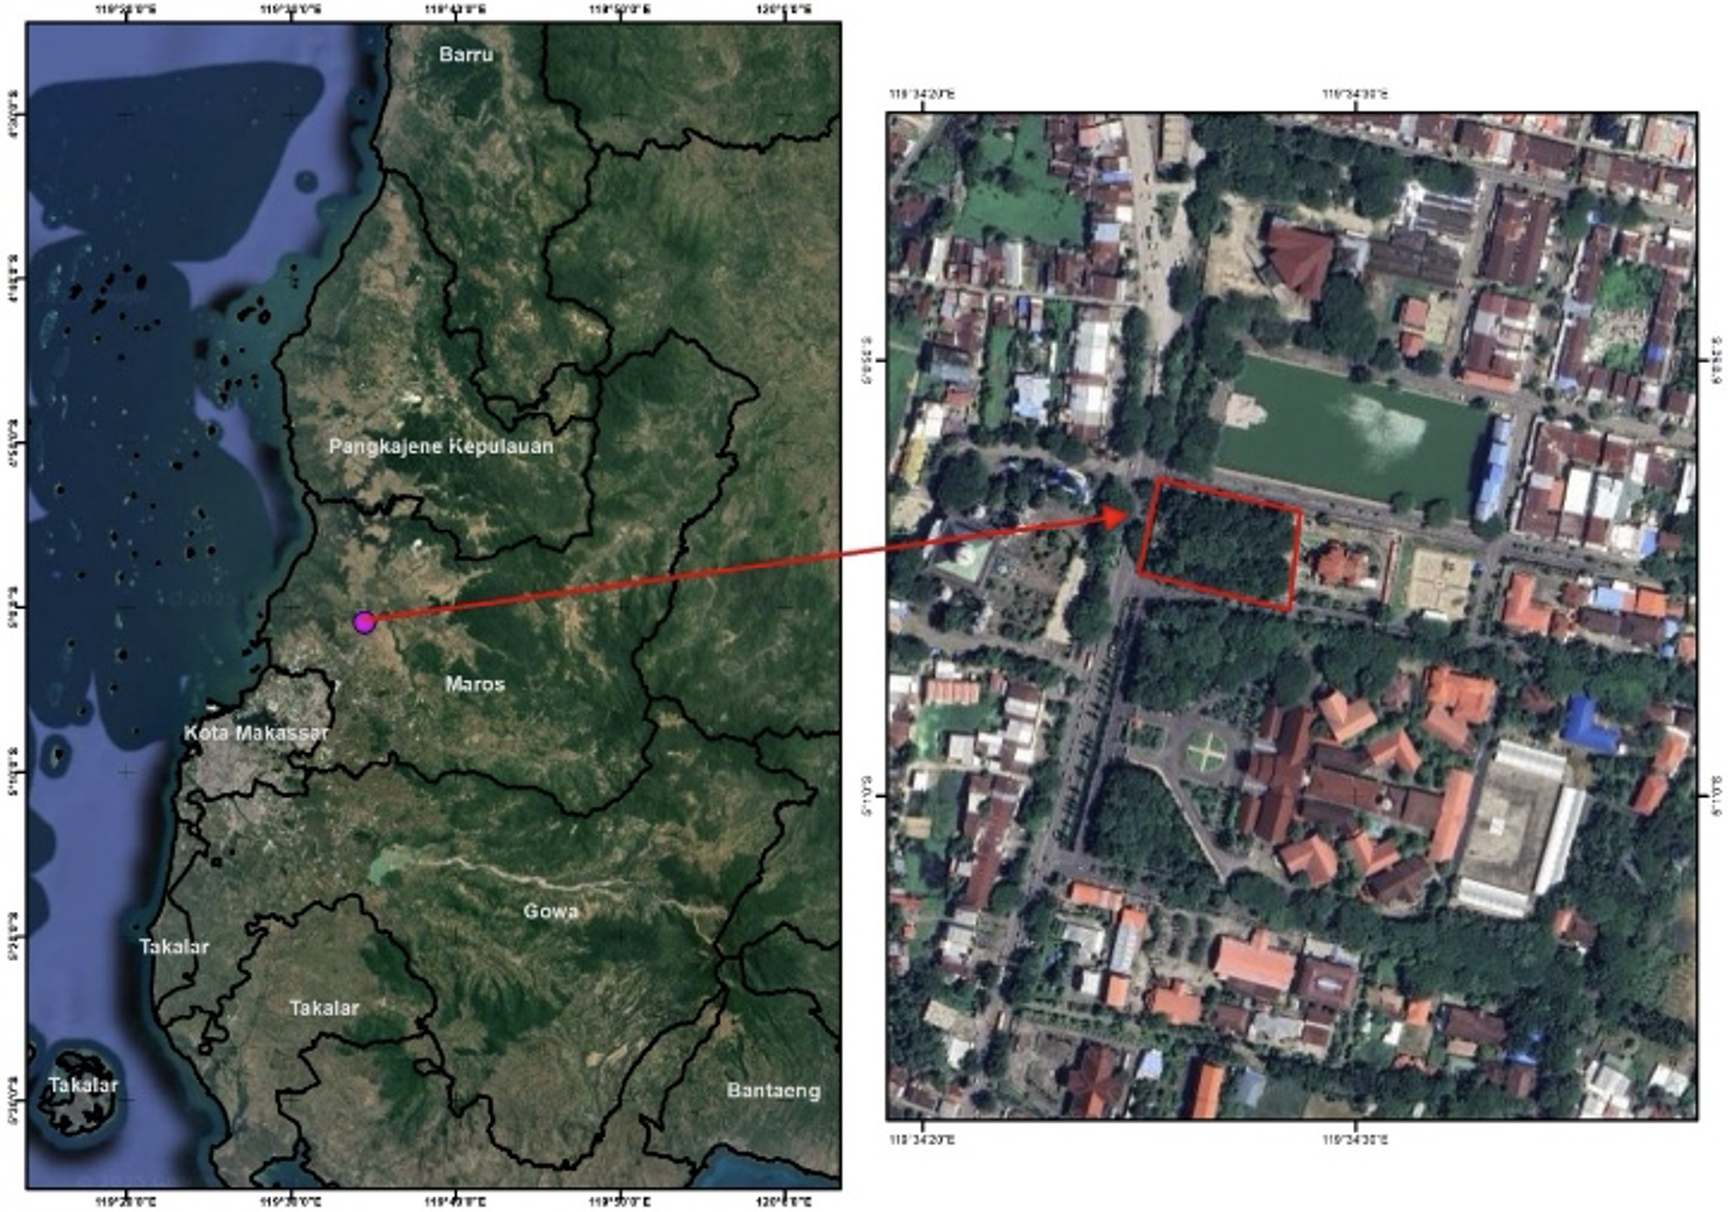
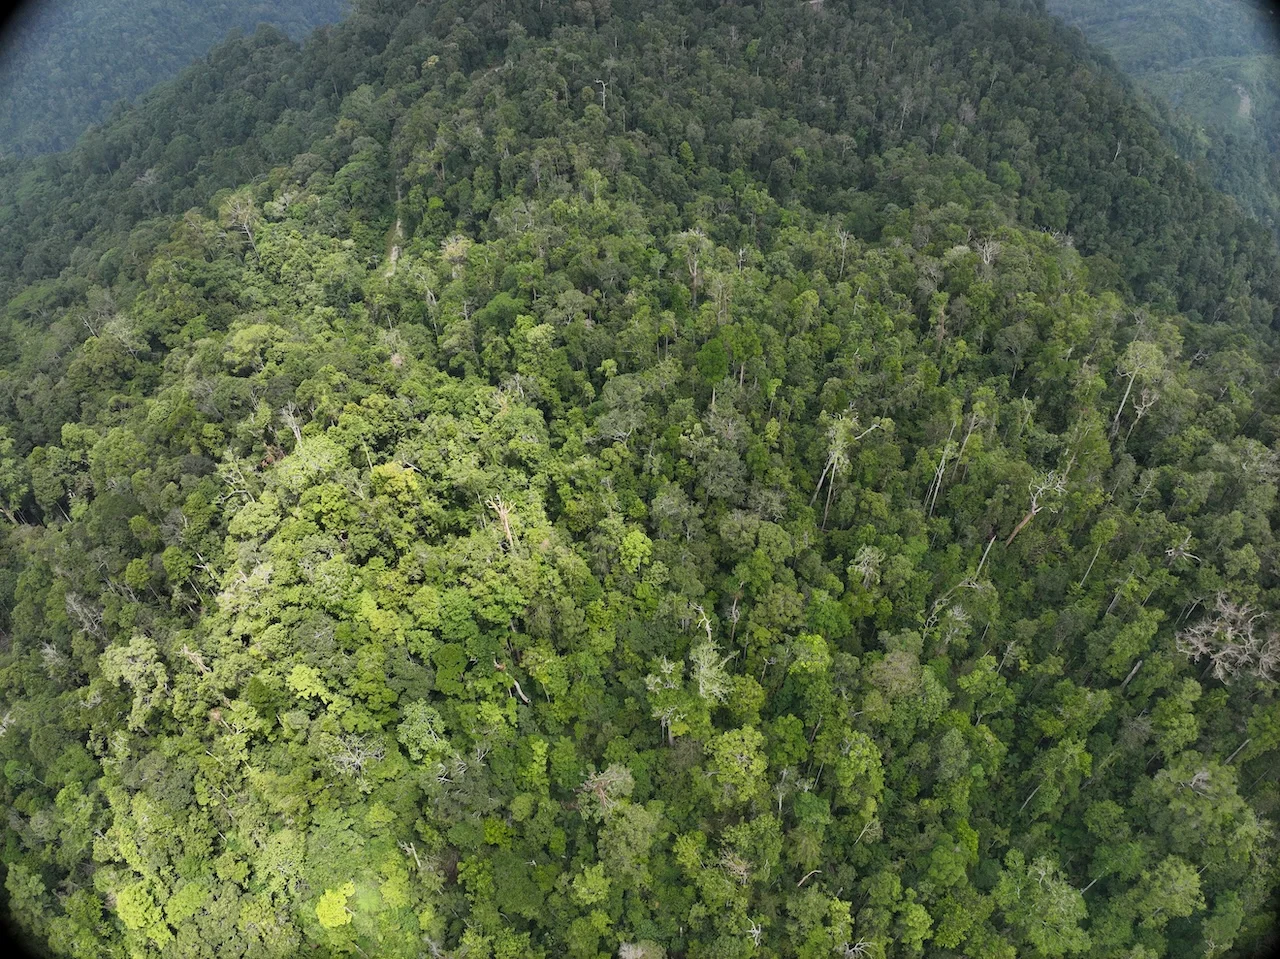
This research was conducted in the Minraleng sub-watershed, which is administratively located within the Cenrana, Camba, and Mallawa Districts of Maros Regency, South Sulawesi Province, Indonesia (Figure 1). The Minraleng Sub-Watershed covers an area of approximately 29,400 hectares and is characterized by a diverse topography ranging from flat to very steep terrain. This area was selected as the research site because it represents the upstream part of the Walanae Watershed, one of Indonesia’s national priority watersheds, and has experienced intensive land-use change in recent years. These conditions make the Minraleng Sub-Watershed an important case study for understanding the impacts of land-use change on water yield and hydrological stability.
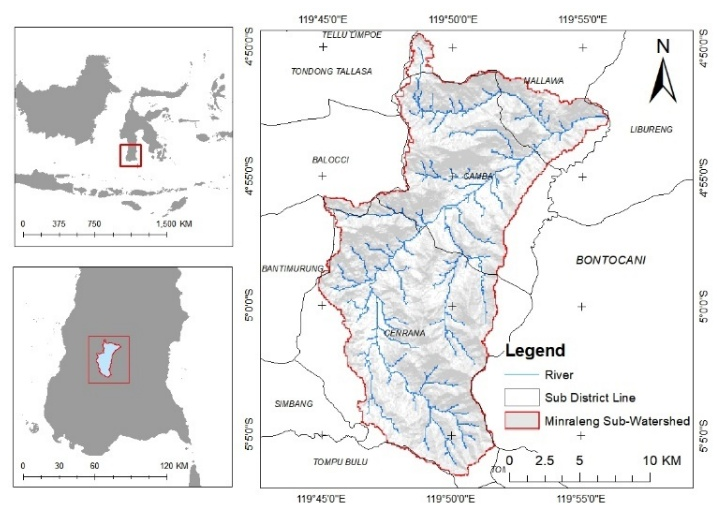
Figure 1. Study area of the Minraleng Sub-Watershed
2) Data Collection
The types of data used in this study, including their periods/resolutions, sources, and collection methods, are summarized in Table 1.
Table 1. Types of data, period/resolution, sources, and collection methods used in the study

3) Data Analysis
Data was analyzed spatially and quantitatively to determine the effects of land cover change on water yield, river discharge, and community adaptation in the Minraleng Sub-Watershed. The analysis stages included land cover change analysis, hydrological modeling using SWAT, calculation of the River Regime Coefficient (RRC), interviews, and spatial analysis of model outputs, as described below:
Land Cover Change Analysis
Land-cover map for 2018 and 2023 were developed based on Sentinel-2 imagery with a 10-meter resolution. Image interpretation was conducted using ArcMap software. The process included image orthorectification, followed by classification to identify land cover types based on tone, color, and texture patterns. Land cover classes were defined according to the SWAT (Soil and Water Assessment Tool) classification model.
ΔA=A2023-A2018
where ΔA represents the change in land cover area (ha).
Soil Physical Properties Analysis
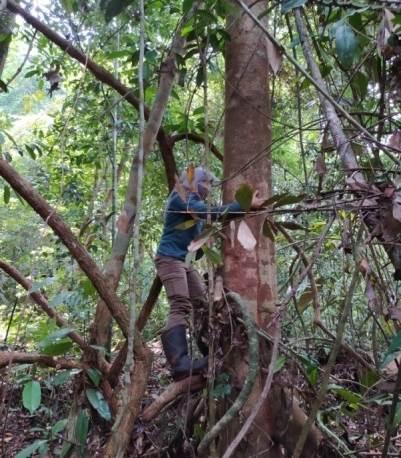
Soil physical data were obtained from a semi-detailed soil map at a scale of 1:50,000. Field soil sampling aimed to determine soil characteristics using a purposive sampling method. Both disturbed and undisturbed soil samples were collected using a ring sampler. The soil parameters used included:
Soil crack volume (SOL_CRK),
Available water capacity (SOL_AWC),
Saturated hydraulic conductivity (SOL_K),
Soil hydrological group (HYDGRP), and
Soil albedo (SOL_ALB).
Laboratory tests on soil samples were conducted to obtain detailed land characteristics as follows:
Number of soil layers (NLAYERS)
Depth of plant roots (SOL_ZMX)
Soil porosity (ANION_EXCL)
where, Particle Density = 2.56 g/cm3
Texture
The results of soil sample analysis obtained the percentage of dust, clay and sand.
%clay = WSCL sand weight + Sand weight x 100 (%)
%silt = WSCL silt weight + Sand weight x 100 (%)
%sand = WSCL clay weight + Sand weight x 100 (%)
WSCL = H1+0.3X(T1-1.98)2-0.5
CW = H2+0.3X(T1-1.98)2-0.5
Silt Weight = WSCL - CW
where, WSCL = Weight of Sand Clay Silt, CW = Clay Weight, H1 and H2 = Suspension measurement with hydrometer, T1 and T2 = Suspension measurement with thermometer
Soil Depth (SOL_Z)
Soil depth is measured after excavation using a tape measure.
Bulk Density (SOL_BD)
Bulk density (BD) values were analysed by taking undisturbed soil samples. The soil samples were dried in an oven for 24 hours at 105°C, then weighed and the soil dry weight or soil volume weight was obtained.
where, Soil Volume=Ring Volume ( r2 t)
Permeability
The disturbed soil sample was soaked overnight in a container. After soaking, the sample is then irrigated with water. The amount of volume that passes through the ring is the total volume of water that can be passed by the soil.
Organic matter (SOL_CBN)
Organic matter levels were analysed using the titration method. The titration results are processed and then the organic matter content in the soil sample is obtained.
Percentage of Clay (CLAY)
where, Weight of Sand Clay Silt (WSCL) = (H1+0,3x(T1-19,8))/2 – 0,5
Percentage of Silt (SILT)
where, Dust Weight = WSCL - WC
Percentage OF Sand (SAND)
Soil Erodibility (USLE K) was estimated based on soil texture and organic matter content.
Soil pH (SOL pH) was determined using the electrometric method
Slope Analysis
The slope gradient was classified into five categories as shown in Table 2.
Table 2. Slope Classes
Source: Ministry of Forestry Standard (2010)
Hydrological Modelling
Hydrological Modeling Process Using the SWAT Model as follows:
Watershed delineation, this process forms the boundaries or defines the watershed being modelled. The process includes set up DEM, stream and watershed definition.
HRU analysis, a process that compiles land use, soil and slope maps to form or define Hydrologic Response Units (HRU) within the modelled watershed area.
Climate database (Weather Generator Data) SWAT model is operated through the weather data definition sub menu. At this stage the input of climate data (Weather Generator Data), rainfall, temperature, humidity, solar radiation, and wind speed.
Build SWAT model input data based on input in stages 1 to 3 that will be formed automatically by selecting the Write All sub menu.
SWAT Simulation is done by selecting the time to be simulated in Run SWAT mode. Saving the output data of simulation results is done by selecting Read SWAT Output.
Calculating River Water Discharge
Calculation of discharge data is done using the SWAT model. SWAT will automatically simulate the amount of discharge value in accordance with the data that has been entered. The principle of SWAT calculation in determining the discharge value uses the Manning equation, namely (Neitsch, et al., 2005):
where, qch: Channel discharge (m3/s), Ach: Channel cross-sectional area (m2), Rch: Hydraulic radius of the channel (m), slpch : Slope along the channel (m/m), n : Manning's roughness coefficient.
Calculation of RRC is done after the minimum and maximum discharge values are known. The KRS calculation is formulated with (Ministry of Forestry RI, 2010):
Table 3. Classification of River Regime Coefficient (RRC)
Source: SK Dirjen RLPS No. P.04/V SET/2009
Method of Validating SWAT Model Results with Interview Results
Validation of the SWAT model results in this study was conducted empirically through a triangulation approach between hydrological simulation outputs and field information obtained from semi-structured interviews with local communities and farmers in each HRU of the Minraleng Sub-Watershed. This approach aimed to evaluate the consistency between the hydrological conditions simulated by the model and the actual conditions experienced by the community. Interviews were conducted with farmers selected through purposive sampling based on their involvement in agricultural activities and utilization of water resources in the study area. Information collected from the interviews included changes in water availability, river discharge conditions during rainy and dry seasons, frequency of surface runoff and erosion, shifts in cropping patterns, and land-use changes in 2023. The interview results were then descriptively compared with SWAT model outputs, particularly for parameters such as river discharge, water yield, and the River Regime Coefficient (RRC).
Validation of the SWAT model results was further carried out empirically using an agreement-level approach between hydrological simulation outputs and community interview findings. Validation was calculated using the following equation:
where V represents the validation agreement level (%), Ns is the number of respondents stating that field conditions were consistent with the model simulation results, and N is the total number of respondents. Validation was performed on hydrological parameters such as changes in river discharge, water availability, and drought conditions based on community perceptions in the Minraleng Sub-Watershed. A higher agreement value indicates that the SWAT simulation results more accurately represent actual hydrological conditions in the field.
3. Result
1) Biophysical Characteristics of the Minraleng Sub-Watershed
The Minraleng Sub-Watershed contains primary soil combinations based on RePPProt data, such as Dystropepts, Dystrandepts, Tropaquepts, Haplorthox, Tropudults, Humitropepts, Tropohumults, Troperthents, Eutropepts, Paleudults, Rendolls, and Tropofluvents.
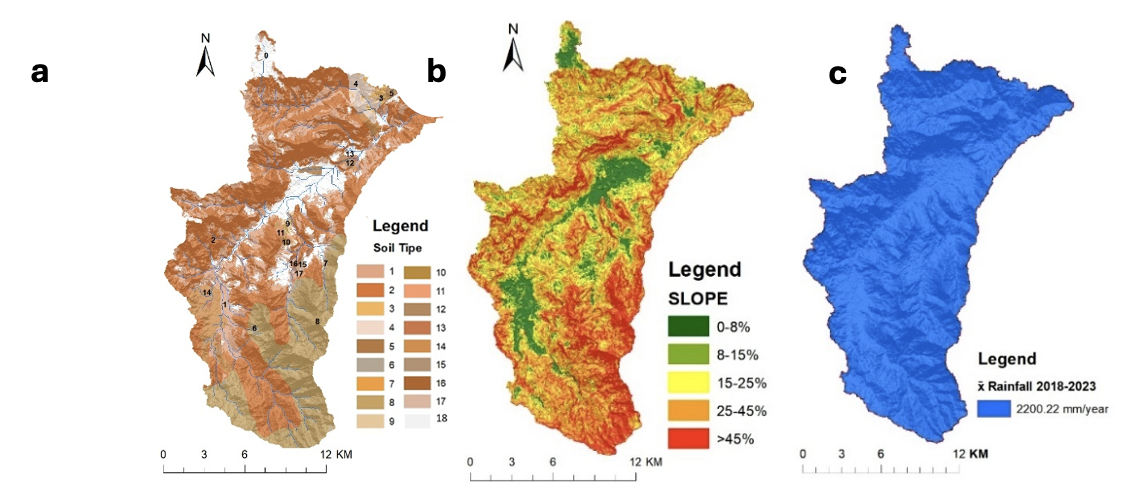
Figure 2. Biophysical characteristics of the Minraleng Sub-Watershed: (a) land unit map, (b) slope map, (c) rainfall distribution map
An overlay of the soil type map and slope map produced land units (Figure 2.a), which served as the basis for determining soil sampling points in the field. Most soils have a sandy clay texture, moderate porosity, slightly acidic pH (5.5–6.5), and relatively low organic matter content in open areas. The topography (Figure 2.b) is dominated by moderately steep slopes (33.15%), followed by gentle slopes (26.37%), flat areas (20.87%), steep slopes (19.09%), and very steep slopes (0.52%). The varied slope distribution, particularly in the upper catchment with steep to very steep terrain, contributes to high surface runoff potential and increased erosion risk. The average annual rainfall during 2018–2023 reached approximately 2,200 mm/year (Figure 2.c). The high and relatively even rainfall reinforces the humid tropical characteristics of the region, increasing runoff potential when vegetation cover declines.
2) Land Cover Change in the Minraleng Sub-Watershed (2018–2023)
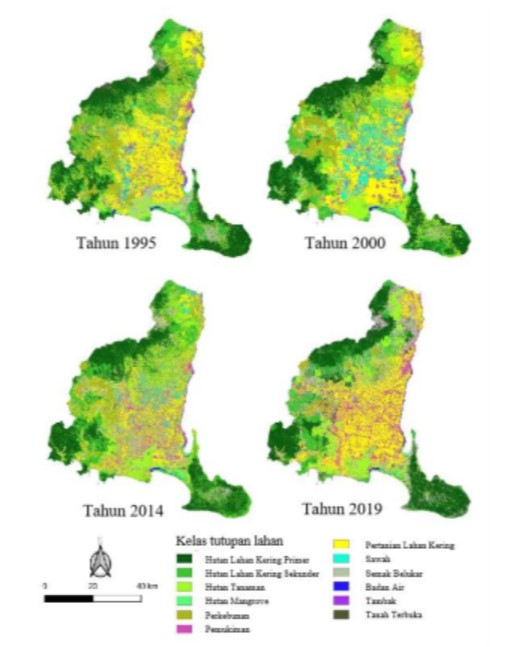
Land use between 2018 and 2023 reflects dynamic agricultural activities and vegetation changes (Figure 3). In 2018, mixed dryland agriculture dominated with 51.37%, followed by secondary forest (24.79%), shrubs (11.46%), and paddy fields (8.7%). By 2023, the proportion of secondary forest increased to 34.18%, while mixed dryland agriculture declined to 41.52%. The expansion of secondary forests indicates natural vegetation regeneration in areas previously used for dryland agriculture or shrubland. Meanwhile, shrub areas decreased, and paddy fields increased from 8.7% to 13.66%, reflecting the conversion of dryland into irrigated agricultural land in areas with better water access. Settlement and plantation cover remained relatively stable at 0.36% and 2.1%, respectively.
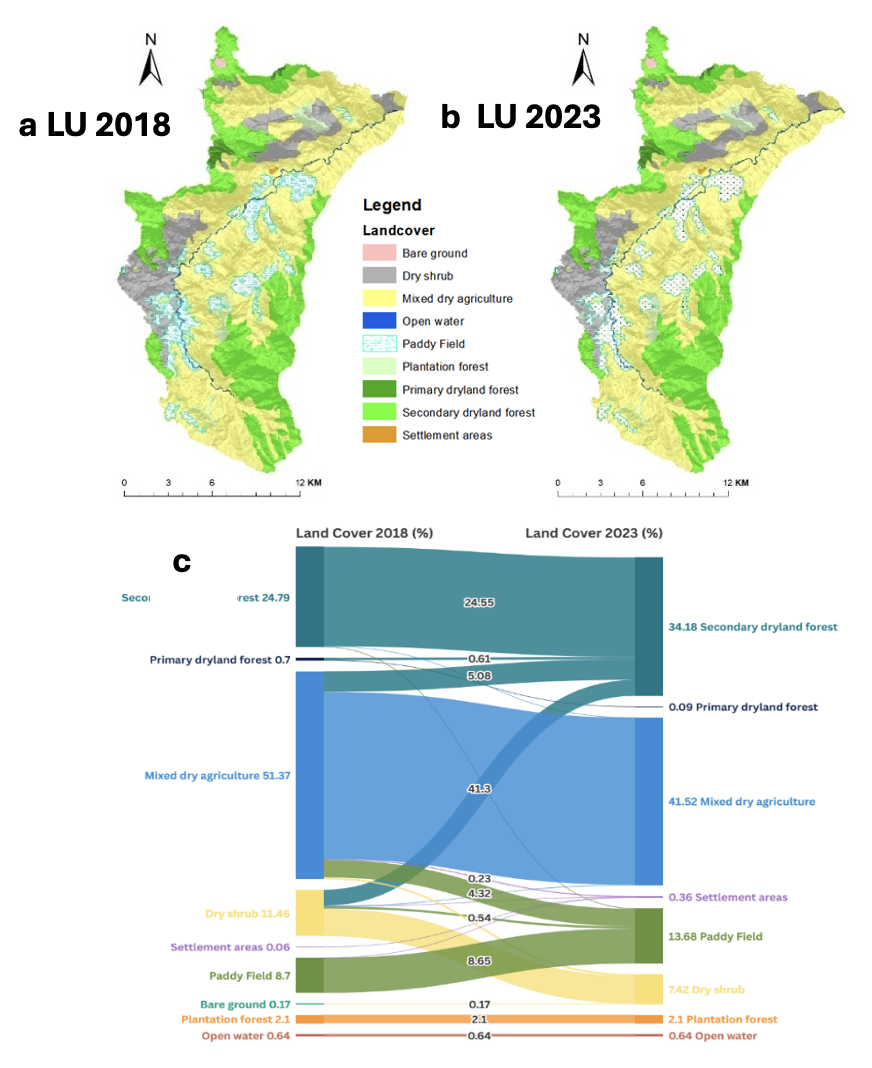
Figure 3. Land Cover of The Minraleng Sub-Watershed: (a) 2018 Map, (b) 2023 Map, (c) Transformation of Land Cover Change From 2018 To 2023.
3) Changes in Water Yield and River Discharge
The Soil and Water Assessment Tool (SWAT) model was simulated over a five-year period (2018–2023) using annual output data, including rainfall, evapotranspiration, surface runoff, and infiltration. In 2018, total annual rainfall reached 2,045.4 mm, distributed into evapotranspiration (787.0 mm; 38.47%), surface runoff (498.48 mm; 24.37%), and infiltration (759.72 mm; 36.52%), consisting of percolation to shallow aquifers (250.52 mm; 12.24%) and lateral flow (496.72 mm; 24.28%) (Figure 4.a). In 2023, rainfall increased to 2,116.8 mm/year with hydrological distribution comprising evapotranspiration (803.5 mm; 37.95%), surface runoff (535.30 mm; 25.28%), and infiltration (771.55 mm; 36.44%), consisting of percolation (262.41 mm; 12.39%) and lateral flow (509.12 mm; 24.05%). Between 2018 and 2023, the Minraleng Sub-Watershed (Figure 4) experienced increases in rainfall and surface runoff, indicating that streamflow was predominantly generated by short-term rainfall events.
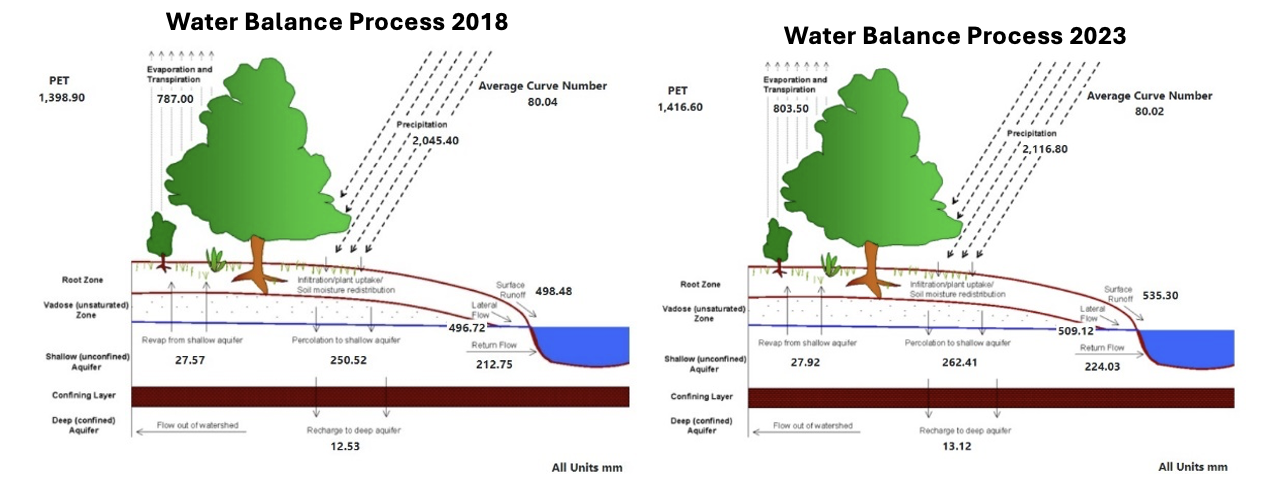
Figure 4. Simulation Results of Hydrological Conditions of Minraleng Sub Watershed, a. Year 2018, b. Year 2023 (source: SWAT model analysis 2024)
4) River Regime Coefficient (RRC)
The calculation of the River Regime Coefficient (RRC) in eight sub-watersheds of the Minraleng Sub-Watershed revealed high streamflow fluctuations between the rainy and dry seasons. In 2018, the highest RRC value was recorded in Sub-watershed 4 at 29,050.63, while the lowest was found in Sub-watershed 3 at 1,152.80. All sub-watersheds 1–4 were classified as Bad due to the very large differences between maximum and minimum discharge. Maximum discharge in sub-watersheds 1–4 ranged from 1.69–5.50 m³/s, whereas minimum discharge was only 0.0002–0.0019 m³/s. These conditions indicate that streamflow in the upstream–midstream watershed areas experienced high fluctuations throughout the year.
Table 4. Discharge and RRC Classes of the Minraleng Sub-watershed
In 2023, RRC values in Sub-watersheds 1–4 increased compared to 2018. The highest value was again found in Sub-watershed 4 at 250,814.58, while the lowest was in Sub-watershed 3 at 1,691.02. The increase in RRC values occurred alongside higher maximum discharge across all sub-watersheds, while minimum discharge declined to nearly zero. Total maximum discharge rose from 112.35 m³/s in 2018 to 133.84 m³/s in 2023, whereas total minimum discharge decreased from 0.0153 m³/s to 0.0031 m³/s.
In Sub-watersheds 5–8, RRC values could not be calculated (undefined) because minimum discharge was 0.0000 m³/s, resulting in division by zero in the RRC equation. Consequently, RRC values in these sub-watersheds were not classified. The zero minimum discharge indicates that several small streams in the study area experienced intermittent flow, particularly during dry periods, when streamflow only occurred after rainfall events and ceased during the dry season. Overall, the results show that the upstream–midstream areas of the Minraleng sub-watershed exhibited higher discharge fluctuations compared to other areas, as reflected in high RRC values and low annual minimum discharge
5) Social historical-based validation
Validation based on community recall indicated that the SWAT model simulation results were consistent with hydrological conditions perceived by local communities in the Minraleng Sub-Watershed in 2023. Communities in Sub-watersheds 1–4 reported that river discharge increased during the rainy season but declined more rapidly in the dry season. This condition aligns with SWAT simulations showing higher maximum discharge and lower minimum discharge in these areas. In Sub-watershed 4, respondents noted that several small streams often dried up during the dry season, consistent with simulation results showing minimum discharge approaching zero.
Table 5. Validation of SWAT Model Simulation Results with Community Interviews in the Minraleng Sub-watershed (2023)
In Sub-Watersheds 5–8, most respondents stated that small streams only appeared a few days after rainfall and ceased flowing within 3 to 5 days. This observation corresponds with SWAT simulations showing minimum discharge values of 0.0000 m³/s in several sub-watersheds. Additionally, communities observed increased surface runoff and stronger streamflow during heavy rainfall compared to previous years. Overall, validation based on community recall demonstrated that the SWAT model successfully represented streamflow variation and hydrological characteristics of the Minraleng Sub-Watershed in accordance with field conditions
4. Discussion
The SWAT simulation results showed that land-use changes in the Minraleng Sub-Watershed during the 2018–2023 period affected water yield dynamics and watershed hydrological response. The increase in rainfall from 2,045.40 mm to 2,116.80 mm was accompanied by a rise in surface runoff from 498.48 mm (24.37%) to 535.30 mm (25.28%) and an increase in maximum discharge from 112.35 m³/s to 133.84 m³/s. Conversely, minimum discharge decreased from 0.0153 m³/s to 0.0031 m³/s. These conditions indicate that the increase in water yield was predominantly driven by quick flow rather than baseflow. The higher rainfall in 2023 contributed more to surface runoff than to infiltration. The simulation results suggest that the watershed responded more rapidly to rainfall, as reflected in increased surface runoff and reduced land cover capacity to retain quick flow.
Changes in water yield in the Minraleng Sub-Watershed were closely related to land-use dynamics during the observation period. A decline in mixed dryland agriculture by 9.85%, accompanied by an increase in secondary dryland forest by 9.39%, contributed to vegetation cover expansion that supports watershed hydrological functions, particularly in maintaining infiltration capacity and reducing surface flow. However, the expansion of paddy fields by 4.98% also influenced hydrological response, as indicated by a 7.39% increase in surface runoff. Although secondary forest cover expanded, runoff contributions from paddy fields remained substantial, resulting in increased surface runoff at the sub-watershed scale. Moreover, secondary dryland forest and mixed dryland agriculture with shrubs are known to have relatively similar surface runoff indices (Amiruddin, 2025), so changes in the proportion of these land uses did not significantly reduce surface runoff.
The key finding of this study is that the expansion of paddy fields coincided with increased surface runoff. In fact, the crop management and land conservation factor (CP) in the USLE for paddy fields is generally lower than that of bare land but higher than that of forest (Budi et al., 2025). the USLE method does not differentiate between paddy field types, such as rainfed and irrigated systems, nor does it account for inundation conditions during land preparation, planting, vegetative, and generative phases (Suprihati et al., 2018). Similar limitations are found in the standard SWAT simulation, which has not yet been able to represent the specific hydrological processes of paddy fields in detail (W. Gassman et al., 2022). Consequently, the relationship between paddy field expansion and watershed hydrological response may not be accurately captured. This is evidenced by the development of SWAT-Paddy (Tsuchiya et al., 2018), which produced significantly better daily discharge simulation performance (R² = 0.80) compared to the standard SWAT (R² = 0.002). These findings highlight that water management characteristics in paddy fields—such as inundation, irrigation, drainage, and water storage capacity within plots—are critical factors that must be integrated into hydrological analysis. Therefore, the increase in surface runoff identified in this study may not fully reflect actual hydrological conditions but rather be influenced by limitations in the representation of paddy fields within the modeling method used. Accordingly, further development or application of hydrological models that explicitly accommodate paddy water management dynamics is required to produce more realistic estimates of runoff and river discharge, particularly in watersheds dominated by paddy land use.
5. Conclusion
Land-cover changes in the Minraleng Sub-Watershed during the 2018–2023 period Were characterized by a decline in mixed dryland agriculture from 51.37% to 41.52% and an increase in secondary dryland forest from 24.79% to 34.18%. The extent of paddy fields also expanded from 8.70% to 13.66%. These changes, together with an annual rainfall increase of 71.40 mm (from 2,045.40 mm to 2,116.80 mm), influenced watershed hydrological response, as indicated by a rise in surface runoff of 7.39%, mean discharge of 5.26%, and maximum discharge of 19.13%. Conversely, minimum discharge decreased by 79.74%, reflecting a reduced capacity of the watershed to sustain baseflow during the dry season.
6. Competing Interests
The authors declare that there is no conflict of interest throughout the entire research process.
7. Acknowledgements
The authors would like to express their sincere gratitude to all parties who provided support, especially the local communities around the Minraleng Sub-Watershed, for their cooperation and assistance during the field data collection activities, which greatly contributed to the successful completion of this research.
8. References
Amiruddin, H. (2025). Surface Erosion and Deposition on Different of Land Utilization type Bunga Watershed Central Sulawesi Province. International Journal of Contemporary Applied Researches, 12(7).
Budi, S. L., Jondan, B. S., & Ikhsan, J. (2025). Erosi dan Sedimentasi Akibat Perubahan Tata Guna Lahan pada DAS Winongo Menggunakan Metode USLE dan Aplikasi Arcgis. Jurnal Penelitian Pengelolaan Daerah Aliran Sungai, 8(2), 113–130. https://doi.org/10.59465/jppdas.2024.8.2.113-130
Cai, Z., Wang, J., Yang, Y., & Zhang, R. (2021). Influence of Vegetation Coverage on Hydraulic Characteristics of Overland Flow. Water, 13(8), 1055. https://doi.org/10.3390/w13081055
Dharmawan, I. W. S., Pratiwi, Siregar, C. A., Narendra, B. H., Undaharta, N. K. E., Sitepu, B. S., Sukmana, A., Wiratmoko, M. D. E., Abywijaya, I. K., & Sari, N. (2023). Implementation of Soil and Water Conservation in Indonesia and Its Impacts on Biodiversity, Hydrology, Soil Erosion and Microclimate. Applied Sciences, 13(13), 7648. https://doi.org/10.3390/app13137648
Firdazam, F., Sangkawati, S., & Wulandari, D. A. (2023). Analysis of The Level of Erosion Hazard in The Walanae Watershed and Land Conservation Directions to Reduce The Erosion Rate in The Walanae Watershed. International Journal of Social Service and Research, 3(12), 3306–3315. https://doi.org/10.46799/ijssr.v3i12.650
Mekonnen, M. M., & Hoekstra, A. Y. (2020). Sustainability of the blue water footprint of crops. Advances in Water Resources, 143, 103679. https://doi.org/10.1016/j.advwatres.2020.103679
Naha, S., Rico-Ramirez, M. A., & Rosolem, R. (2021). Quantifying the impacts of land cover change on hydrological responses in the Mahanadi river basin in India. Hydrology and Earth System Sciences, 25(12), 6339–6357. https://doi.org/10.5194/hess-25-6339-2021
Neitsch, S., Arnold, J., Kiniry, J.& Williams J. (2005). Soil and Water Assessment Tool Theoretical Documentation – Version 2005. Grassland, Soil & Water Research Laboratory, Agricultural Research Service, and Blackland Agricultural Research Station, Temple, TX, pp. 1–12.
Paiva, K., Rau, P., Montesinos, C., Lavado-Casimiro, W., Bourrel, L., & Frappart, F. (2023). Hydrological Response Assessment of Land Cover Change in a Peruvian Amazonian Basin Impacted by Deforestation Using the SWAT Model. Remote Sensing, 15(24), 5774. https://doi.org/10.3390/rs15245774
Pemerintah Kabupaten Maros (Pemkab). (2021). Profil Kabupaten Maros 2021.
Peña-Arancibia, J. L., Bruijnzeel, L. A., Mulligan, M., & van Dijk, A. I. J. M. (2019). Forests as ‘sponges’ and ‘pumps’: Assessing the impact of deforestation on dry-season flows across the tropics. Journal of Hydrology, 574, 946–963. https://doi.org/10.1016/j.jhydrol.2019.04.064
Suprihati, R., Hanani, N., Irianto, S. G., & Soemarno, S. (2018). Buffering capacity of paddy field as the reservoir of rainwater and surface runoff in the Lowokwaru subdistrict, Malang, East Java. Journal of Degraded and Mining Lands Management, 5(2), 1065–1076. https://doi.org/10.15243/jdmlm.2018.052.1065
Tajuddin, Supratman, Salman, D., Yusran, Y., & Sahide, M. A. K. (2018). Integrated Analysis of Forest Policies and Their Impacts on Landscape and Lifescape Dynamics: A Case Study in The Walanae Forest Management Unit, Indonesia. Journal of Landscape Ecology, 11(3), 155–174. https://doi.org/10.2478/jlecol-2018-0017
Tsuchiya, R., Kato, T., Jeong, J., & Arnold, J. G. (2018). Development of SWAT-Paddy for Simulating Lowland Paddy Fields. Sustainability, 10(9), 3246. https://doi.org/10.3390/su10093246
van Emmerik, T. H. M., Li, Z., Sivapalan, M., Pande, S., Kandasamy, J., Savenije, H. H. G., Chanan, A., & Vigneswaran, S. (2014). Socio-hydrologic modeling to understand and mediate the competition for water between agriculture development and environmental health: Murrumbidgee River basin, Australia. Hydrology and Earth System Sciences, 18(10), 4239–4259. https://doi.org/10.5194/hess-18-4239-2014
W. Gassman, P., Jeong, J., Boulange, J., Narasimhan, B., Kato, T., Somura, H., Watanabe, H., Eguchi, S., Cui, Y., Sakaguchi, A., Hoang Tu, L., Jiang, R., Kim&Jeffrey G. Arnold, M.-K., & Ouyang, W. (2022). Simulation of rice paddy systems in SWAT: A review of previous applications and proposed SWAT+ rice paddy module. International Journal of Agricultural and Biological Engineering, 15(1), 1–24. https://doi.org/10.25165/j.ijabe.20221501.7147
Ware, H. H., Chang, S. W., Lee, J. E., & Chung, I.-M. (2024). Assessment of Hydrological Responses to Land Use and Land Cover Changes in Forest-Dominated Watershed Using SWAT Model. Water, 16(4), 528. https://doi.org/10.3390/w16040528
Zhang, H., Wang, B., Liu, D. L., Zhang, M., Leslie, L. M., & Yu, Q. (2020). Using an improved SWAT model to simulate hydrological responses to land use change: A case study of a catchment in tropical Australia. Journal of Hydrology, 585, 124822. https://doi.org/10.1016/j.jhydrol.2020.124822
Hak Cipta (c) 2026 Jurnal Wasian

This work is licensed under a Creative Commons Attribution 4.0 International License.
Artikel ini berlisensi Creative Commons Attribution 4.0 International License.
Copyright and License
All articles published in Wasian Journal are the property of the authors. By submitting an article to Wasian Journal, authors agree to the following terms:
-
Copyright Ownership: The author(s) retain copyright and full publishing rights without restrictions. Authors grant the journal the right to publish the work first and to distribute it as open access under a Creative Commons Attribution 4.0 International License (CC BY 4.0).
-
Licensing: Articles published in Wasian Journal are licensed under a Creative Commons Attribution 4.0 International License (CC BY 4.0). This license allows others to share, copy, and redistribute the material in any medium or format, and adapt, remix, transform, and build upon the material for any purpose, even commercially, provided that proper credit is given to the original author(s) and the source of the material

This work is licensed under a Creative Commons Attribution 4.0 International License. -
Author's Rights: Authors are permitted and encouraged to post their work online (e.g., in institutional repositories or on their website) prior to and during the submission process, as it can lead to productive exchanges and greater citation of published work.
-
Third-Party Content: If your article contains material (e.g., images, tables, or figures) for which you do not hold copyright, you must obtain permission from the copyright holder to use the material in your article. This permission must include the right for you to grant the journal the rights described above.
-
Reprints and Distribution: Authors have the right to distribute the final published version of their work (e.g., post it to an institutional repository or publish it in a book), provided that the original publication in Wasian Journal is acknowledged.
For the reader you are free to:
- Share — copy and redistribute the material in any medium or format for any purpose, even commercially.
- Adapt — remix, transform, and build upon the material for any purpose, even commercially.
- The licensor cannot revoke these freedoms as long as you follow the license terms.
Under the following terms:
- Attribution — You must give appropriate credit , provide a link to the license, and indicate if changes were made . You may do so in any reasonable manner, but not in any way that suggests the licensor endorses you or your use.
- No additional restrictions — You may not apply legal terms or technological measures that legally restrict others from doing anything the license permits.
Notices:
You do not have to comply with the license for elements of the material in the public domain or where your use is permitted by an applicable exception or limitation .
No warranties are given. The license may not give you all of the permissions necessary for your intended use. For example, other rights such as publicity, privacy, or moral rightsmay limit how you use the material.

Artikel paling banyak dibaca berdasarkan penulis yang sama
- Asikin Muchtar, Nirwana Nirwana, Wahyullah Wahyullah, Mahmud Mahmud, Ummu Kultsum, Analysis of the Success and Vigour of Cashew Seedlings Through Direct Seed Planting (Anacardium occidentale L.) for Sustainable Land Management , Jurnal Wasian: Vol 11 No 2 (2024): December