
Will Indonesia's Forests Survive Development Pressure? Machine Learning Predictions for Energy-Critical Tropical Watersheds

Abstract
Land Use and Land Cover (LULC) changes play an important role in influencing the hydrological conditions of a watershed. The conversion of land such as forests, shrubs and grasslands into agricultural land can disrupt the hydrological balance of the watershed. The availability of information related to LULC dynamics in the future is needed to assist sustainable watershed management planning. Machine learning technology, such as Cellular Automata, can provide accurate predicting. The objective of this research is to simulate LULC based on machine learning in the Mamasa Sub-watershed. Two model combinations were employed to simulate LULC: Artificial Neural Network-Cellular Automata (ANN-CA) and Logistic Regression-Cellular Automata (LR-CA). The research results found that the ANN-CA model achieved percent of correctness and overall kappa of 83.6745 and 0.75412, respectively, which were higher than those of the LR-CA model (82.3498 and 0.73361). The prediction results of both model combinations still fall below the actual LULC values, especially in the case of large LULC classes such as forests, range-shrub, rice, and pasture. Conversely, higher accuracy is observed for smaller classes such as wetlands-forested, orchard, residential, and oak. However, it should be noted that this research did not include several socio-economic variables, such as population and income level, which are considered to influence changes in LULC. Future research is expected to analyse the influence of each variable and include some socio-economic variables that may have a significant influence on LULC change.
1. Introduction
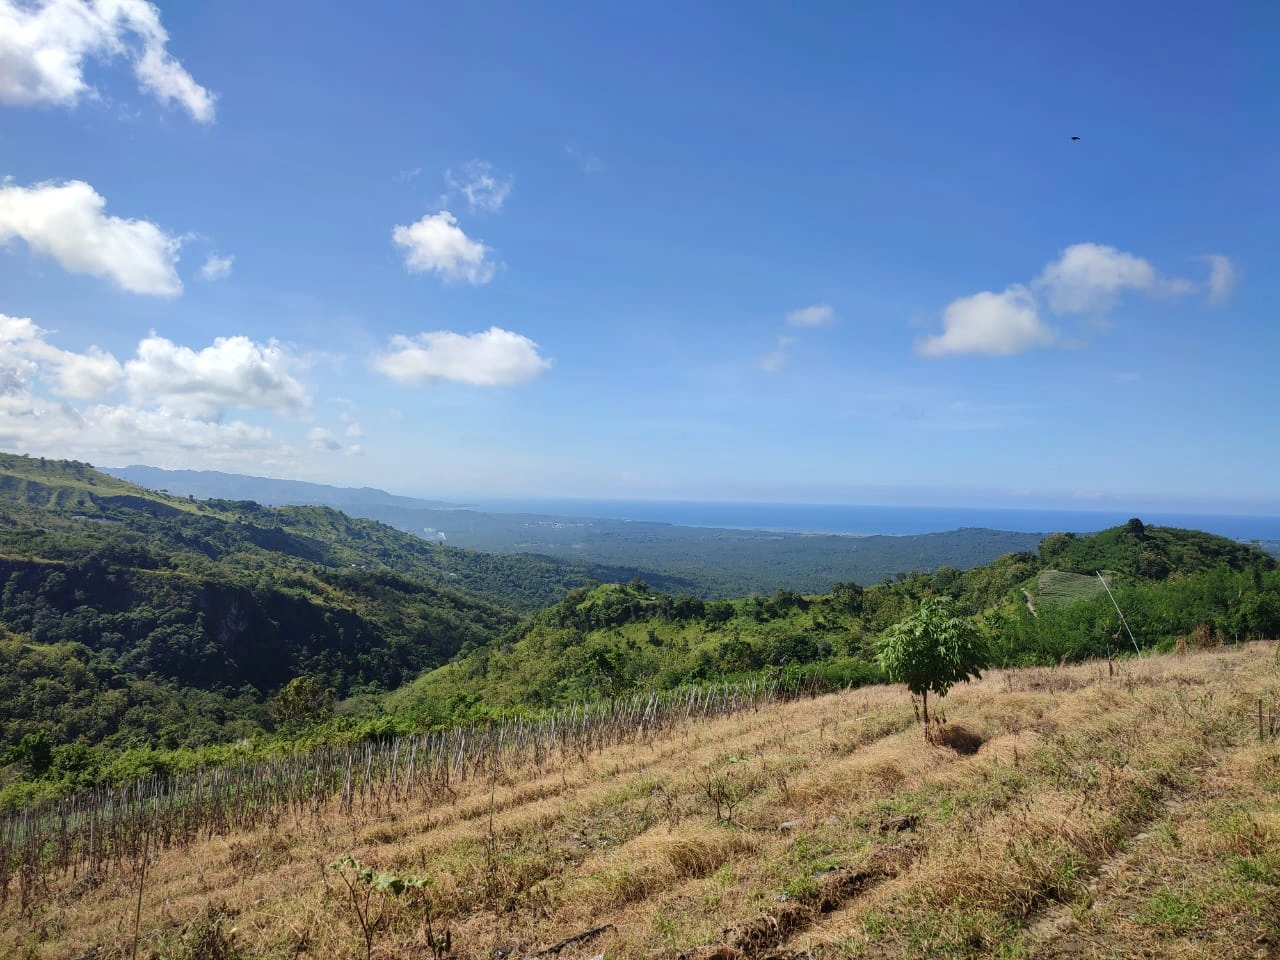
Land use and land cover (LULC) changes play an important role in influencing the hydrological conditions of a watershed. The conversion of forest land, shrubs, and grasslands into agricultural land can disrupt the hydrological balance of a watershed (Regasa, Nones, & Adeba, 2021). One of the impacts of such land conversion is the increased rate of erosion, which causes siltation of rivers and water bodies (Isra, Arsyad, & Chairuddin, 2023). This condition alters the hydrological balance, including increased surface runoff and changes in river discharge, thereby reducing the benefits provided by watershed areas, such as the Mamasa Sub-watershed (Sugianto et al., 2022). Mamasa Sub watershed plays an important role because it provides water discharge for the Bakaru Hydroelectric Power Plant, where water discharge is the main input in the process of producing electrical energy (Singh & Singal, 2017; Stickler et al., 2013). If the hydrological condition of the Mamasa Sub watershed declines, it can disrupt the electricity production process, which has an impact on the sustainability of electrical energy supply.
Regular monitoring is of paramount importance to assess changes and the current status of LULC (Kim, 2016; Reddy et al., 2016; Vaggela, Sanapala, & Mokka, 2022). In Indonesia, the Ministry of Environment and Forestry (MoEF) has taken steps to conduct periodic monitoring of LULC, particularly with regard to forests, on an annual basis. However, the acquisition of LULC data has not been complemented by efforts to predict future LULC patterns based on the ongoing dynamics of changes. Precise predictions of LULC data would prove immensely valuable to stakeholders involved in decisions-making and policy formulation, as they can shape future LULC conditions (Hamad, Balzter, & Kolo, 2018; Liu et al., 2017; Singh et al., 2018). The availability of methods and technology for predicting LULC can offer solutions to these challenges.
The rapid advancement of Geographic Information System (GIS) technology has enabled researchers to engage in diverse spatial modeling task. This progress is further facilitated by the introduction of machine learning as a novel technology that enables the prediction of dynamic spatial changes, including changes in LULC (Chaturvedi & de Vries, 2021). Numerous studies have been undertaken to assess the accuracy of machine learning-based LULC prediction models. Cellular automata stand out as the machine learning algorithm widely employed in contemporary LULC simulations (Koko et al., 2020; Rimal et al., 2017; Salakory & Rakuasa, 2022). Land use and land cover simulations based on cellular automata have consistently demonstrated high levels of accuracy (Rimal et al., 2017).
The cellular automata algorithm operates by identifying spatial patterns based on the transition potentials of cells (pixels), which are derived from initial conditions, environmental factors, and predefined transition rules (Hu, Li, & Lu, 2018). Consequently, LULC simulations that rely on cellular automata are frequently integrated with various models to predict potential land transitions. These models encompass Markov chains (Salakory & Rakuasa, 2022; Ghosh et al., 2017), Artificial Neural Network (ANN) (Saputra & Lee, 2019; Zeshan, Mustafa, & Baig, 2022), logistic regression (Koko et al., 2020), random forest (Gounaridis et al., 2019), as well as several metaheuristic approaches, including particle swarm optimization (PSO), generalized simulated annealing (GSA) and genetic algorithm (GA) (Feng, Liu, & Tong, 2018). The selection of the appropriate transition model plays a crucial role in enhancing the accuracy of cellular automata-based simulations (Zhuang et al., 2017). Land potential transition models, such as artificial neural network and logistic regression, represent viable option as they consistently yield satisfactory results.
Research related to LULC simulation based on machine learning is to support watershed management planning (Li & Yeh, 2002). As reported by previous studies, machine learning can provide accurate prediction. The primary objective of this study is to simulate a LULC based on machine learning for monitoring LULC change in the Mamasa Sub watershed. This research involves the integration of the cellular automata algorithm with two additional algorithms, namely artificial neural network and logistic regression, to create land transition models. Subsequently, the simulation results will be rigorously evaluated to identify the most effective approach. Furthermore, this combined modeling approach will be utilized to forecast LULC patterns for the years 2026 and 2031 within the Mamasa Sub watershed. The anticipated outcome of this research extends to the provision of valuable data that can inform the development of Mamasa sub watershed management plans in the future.
2. Method
1) Study Area
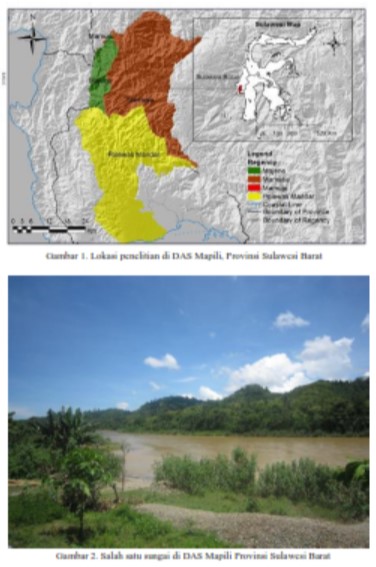
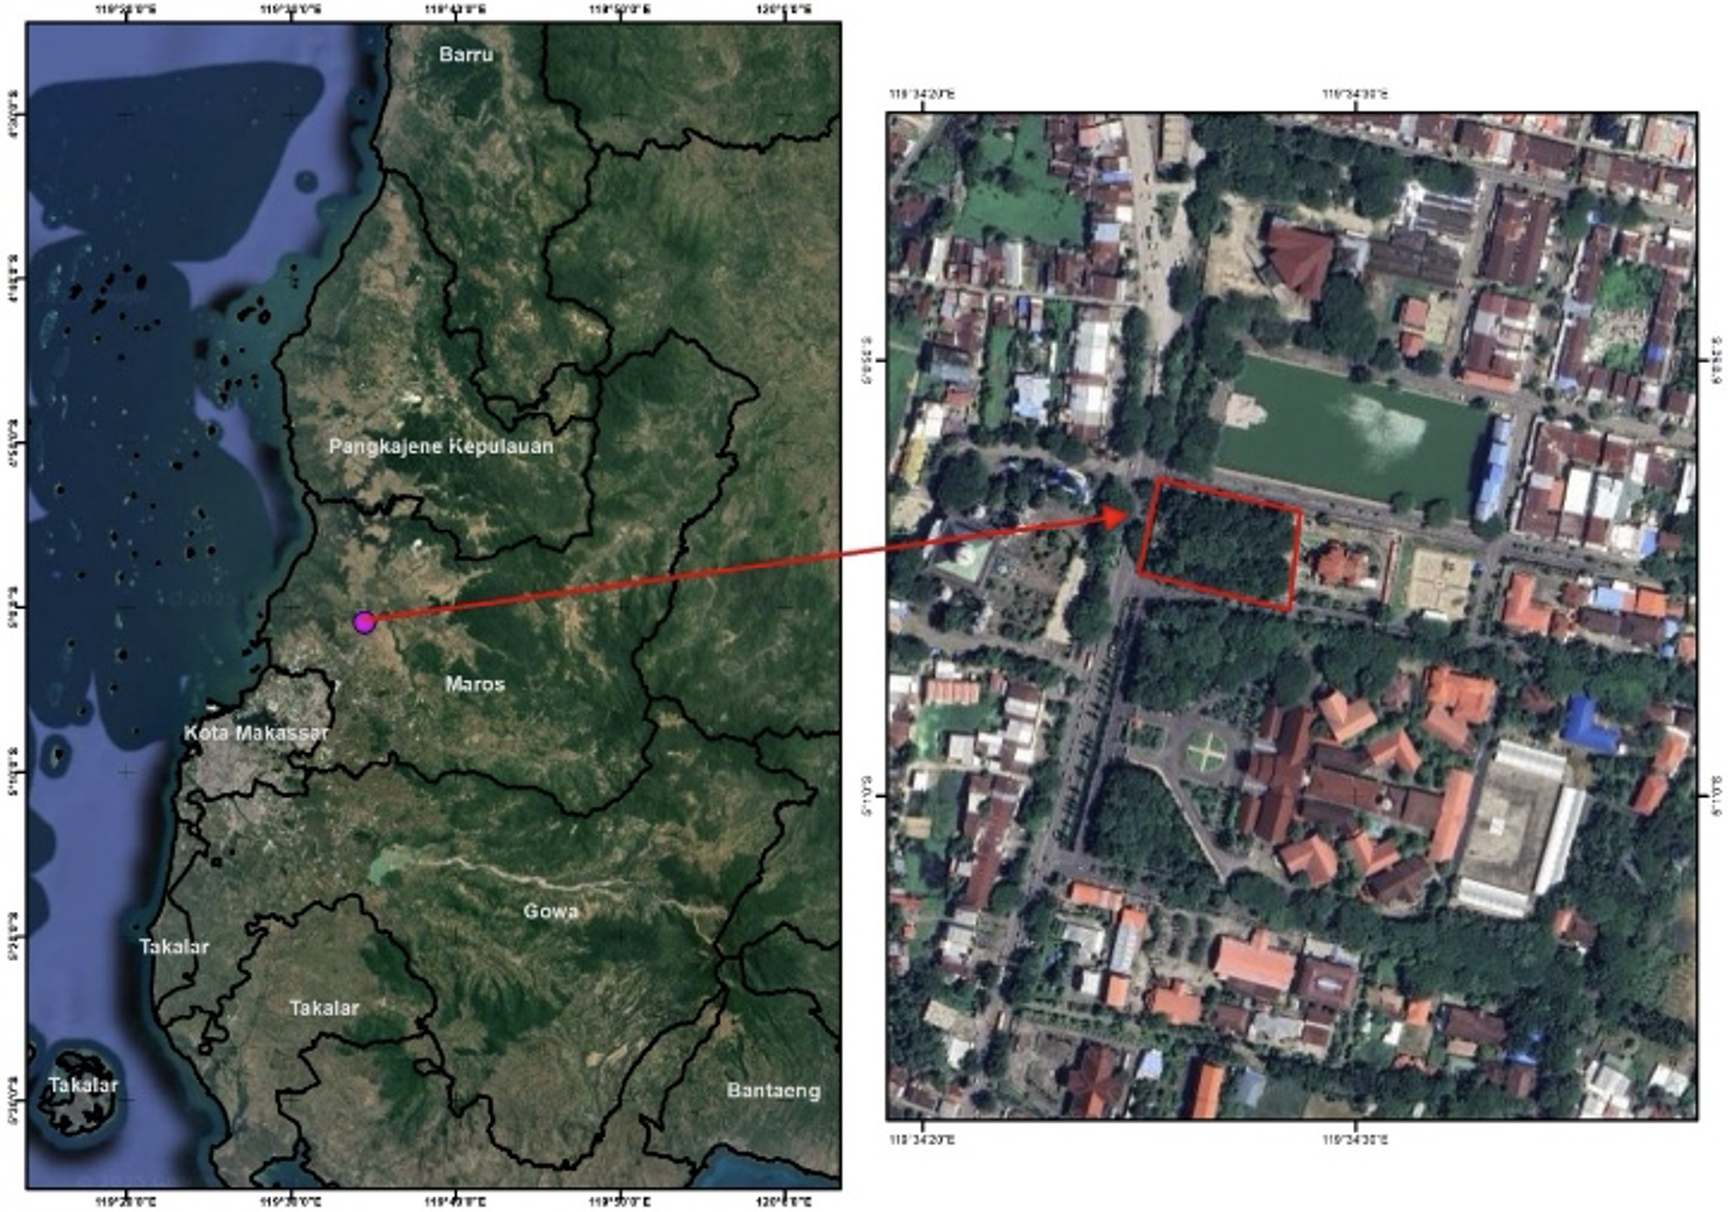
This research was conducted within the Mamasa Sub watershed, as depicted in Figure 1. The Mamasa Sub watershed is an integral part of the Saddang Watershed, falling under the category of a large watershed. It is situated between two provinces, namely West Sulawesi (upstream) and South Sulawesi (downstream) provinces. The total area covered by the Mamasa Sub watershed encompasses approximately 116,108.37 hectares. The Mamasa Sub watershed plays a significant role in supplying water discharge, which is vital for the operation of the Bakaru Hydroelectric Power Plant. This hydroelectric facility is equipped with two turbines, each boasting a power capacity of 63 Megawatts. It serves as the primary source of electricity for meeting the substantial power requirements of the South Sulawesi Province. It is essential to note that the LULC condition within this area has a direct impact on the water discharge generated by the Mamasa Sub watershed. These conditions, in turn, influence the electricity production of the Bakaru hydroelectric power plant.
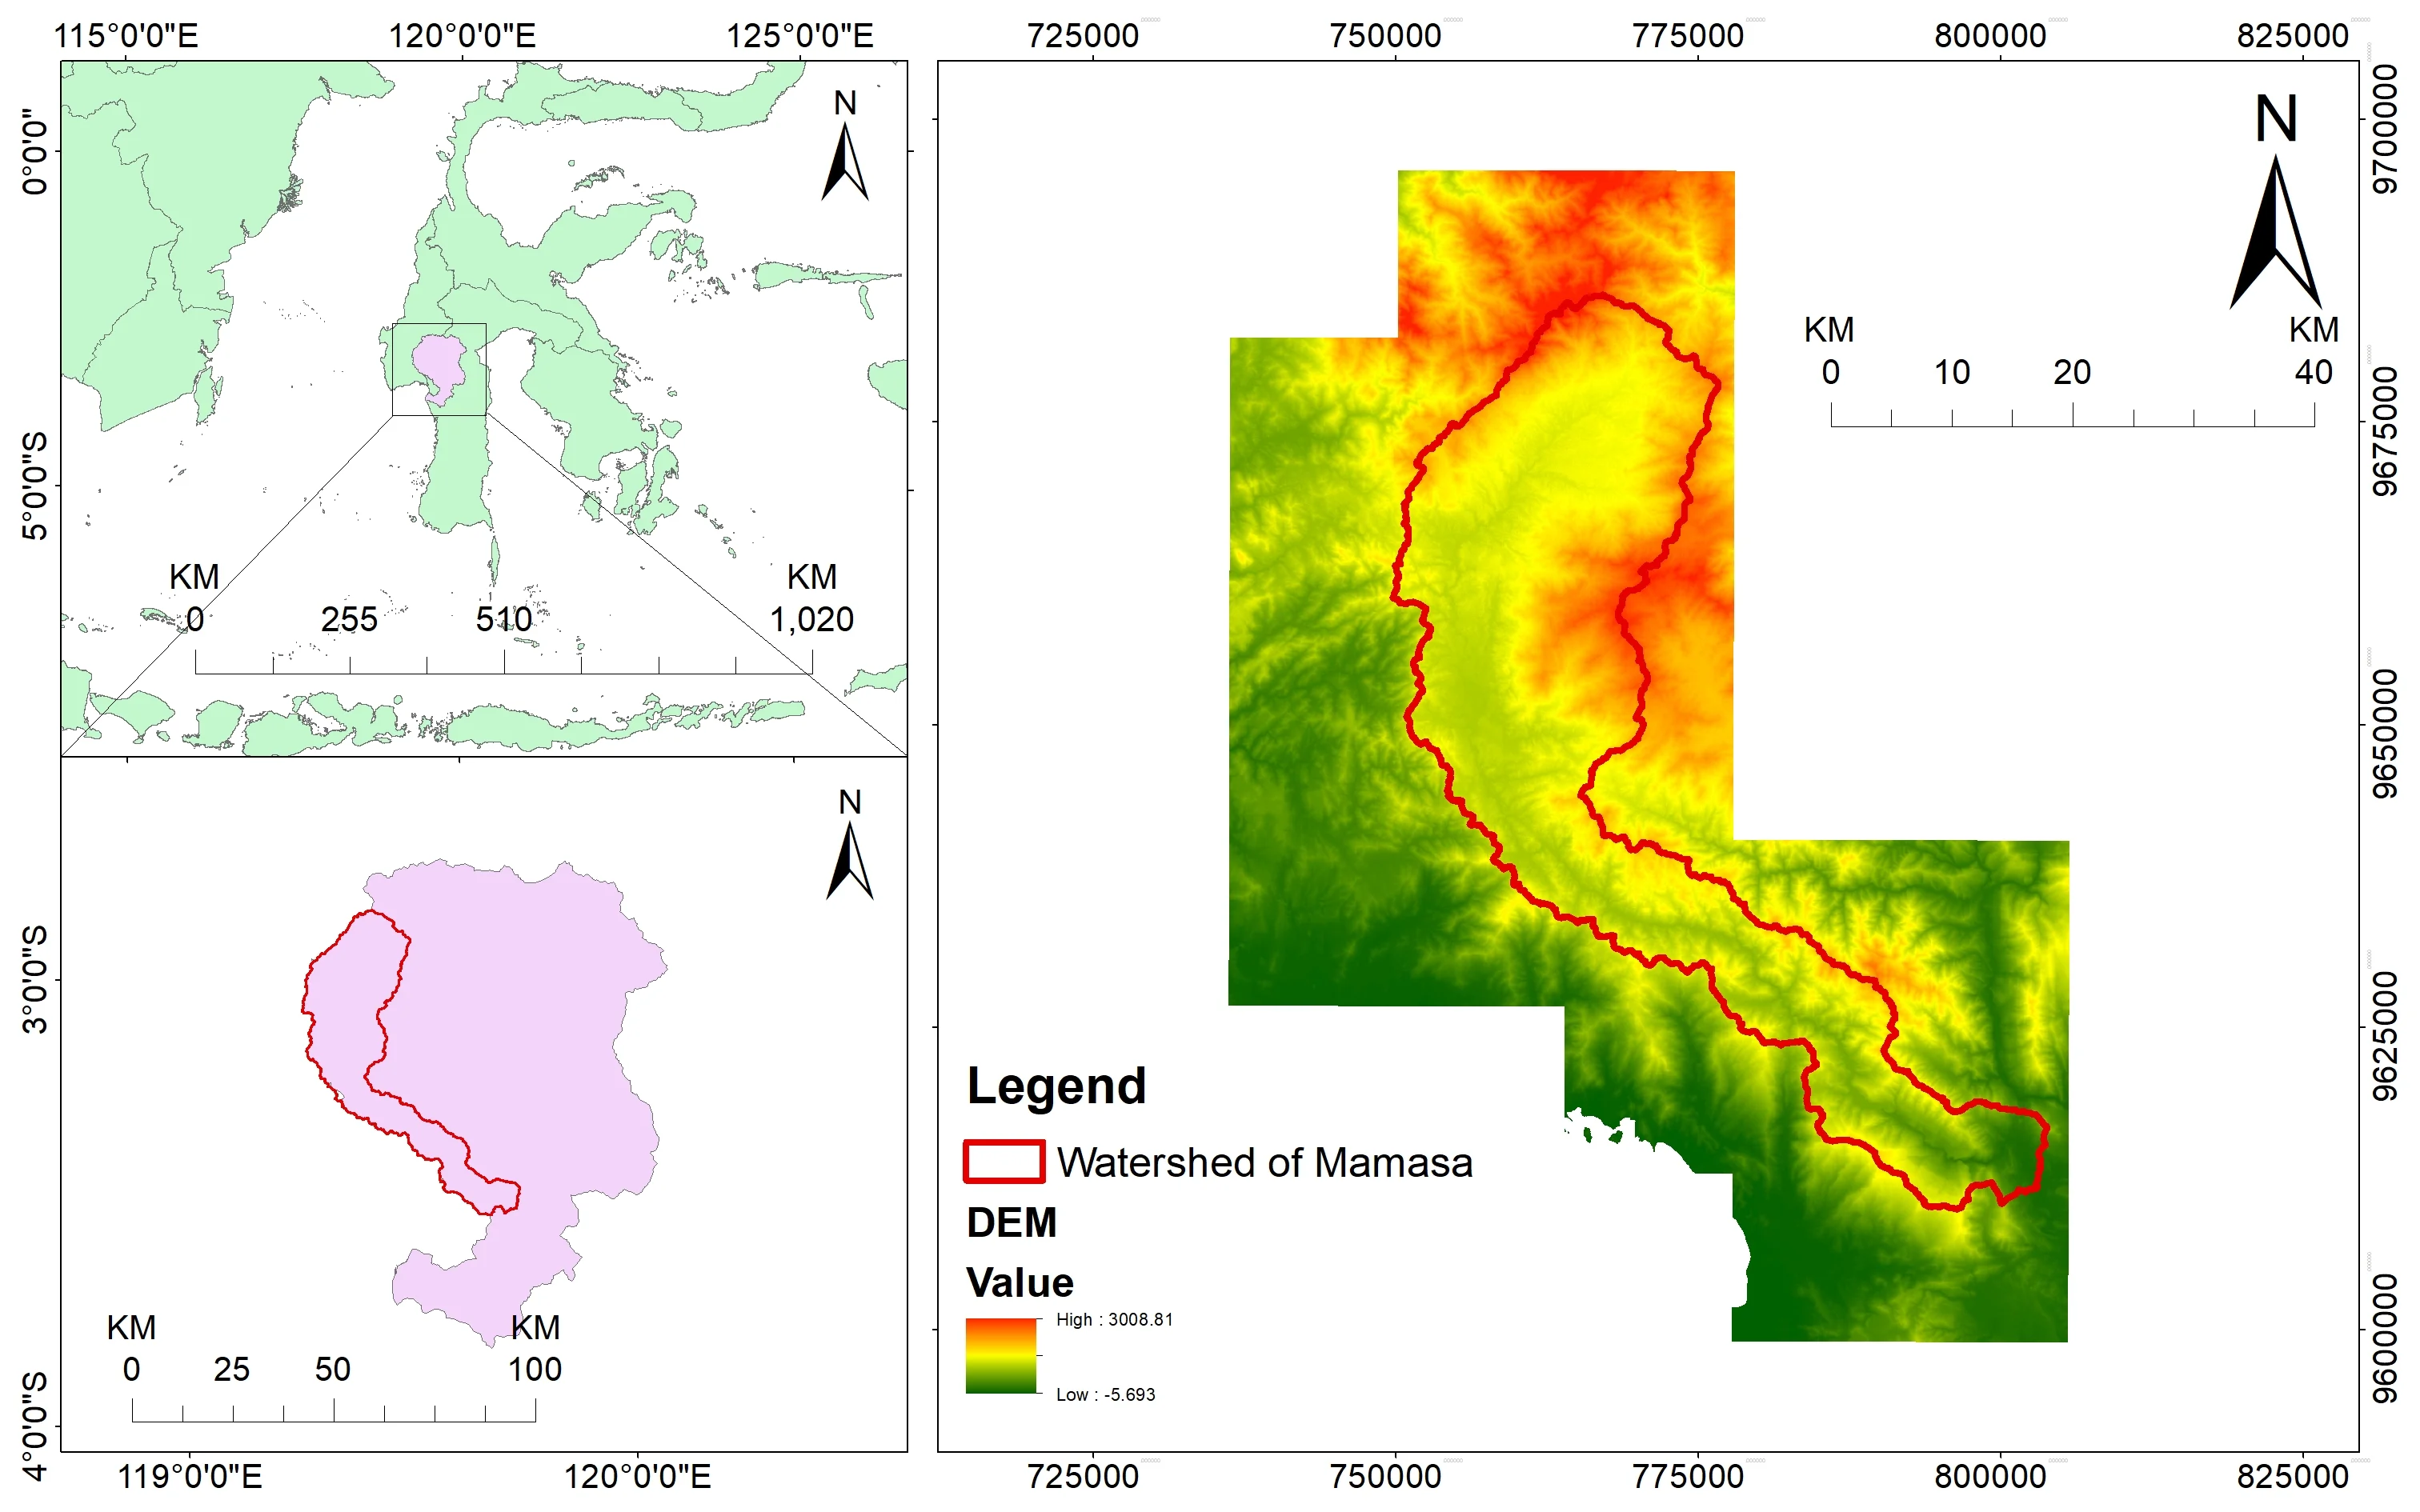
Figure 1. Research Location Map
2) Materials
Land use and land cover data were procured from the Ministry of Environment and Forestry, encompassing LULC information for the years 2011, 2016, and 2021. The LULC data for 2011 and 2016 were employed in land change analysis and for modeling potential transitions. In contrast, the validation of the models was conducted using the LULC data from 2021. This research leveraged five spatial variables as driving factors for predicting LULC changes. These variables include the Digital Elevation Model (DEM), slope, distance from roads, distance from residential areas, and distance from rivers. A detailed description of the data sources and characteristics is provided in Table 1.
Table 1. Data used in the study

3) Data Analysis
Preprocessing data
This stage involves data preparation to make it suitable for processing within the GIS application utilized for this modeling. This includes the conversion of spatial variables such as slope and river network into the appropriate format. The modeling of LULC necessitates input data in raster format. Therefore, spatial data in alternative formats, such as LULC, road network, residential areas, and rivers (typically stored as shapefile), must first undergo conversion into raster data, as outlined by Saputra and Lee (2019). Furthermore, it is imperative that all datasets share a consistent pixel size, as highlighted by Liu et al. (2017). In this study, a pixel size of 30 meters was adopted as the standard for all datasets, ensuring uniformity and compatibility in the analysis.
Spatial variable correlation analysis
Changes in LULC can be influenced by a multitude of factors, encompassing both biophysical and socio-economic variables, as highlighted in studies by Salakory and Rakuasa (2022) and Singh et al. (2018). The selection of these spatial variables is primarily contingent upon data availability, as emphasized by Ghosh et al. (2017). Within this study, the spatial variables employed comprise DEM, slope, distance from roads, distance from rivers, and distance from residentials. To ensure the absence of multicollinearity among these spatial variables, a correlation analysis was conducted. This step is vital to confirm that there are no strong relationships among the variables, as recommended by Feng et al. (2018) and Mustafa et al. (2018). Pearson correlation is employed to assess the relationship, with coefficients falling between -0.7 and 0.7 indicating the absence of a strong correlation, in line with the criteria established by Avtar et al. (2022) and Marshall et al. (2021).
LULC Change Analysis
Land use and land cover data from 2011 and 2016 were utilized to generate LULC change maps as well as transition matrices. The Modules for Land-Use Change Simulation (Molusce) plugin version 3.0.13 in QGIS software version 2.18.15 was employed for the analysis of LULC changes. These land use and land cover change maps, along with the corresponding transition matrices, are essential components in the development of potential transition models.
Transition potential modelling
The potential transition model of land use and cover uses the Artificial Neural Network-Multilayer Perceptron (ANN-MLP) algorithm and logistic regression which is available in the Molusce plugin in QGIS software [19, 26, 28–30]. Multilayer Perceptron is an ANN algorithm consisting of one input layer, one or more hidden layer, and one output layer. Each layer has neurons, and the neurons in MLP process the input, apply weights to the input and use an activation function to process input and weights to produce output or target variable. Logistic regression is a statistical model used to describe the relationship between one or more explanatory variables and a binary target variable, which typically two possible values, such as 0 and 1.
The model parameters employed in ANN-MLP include 1000 samples, neighborhood 1, learning rate 0.001, maximum iteration 100, hidden layer 10, and momentum 0.05. Meanwhile, the model parameters used in logistic regression include sample size of 1000, neighborhood 1, and a maximum of 100 iterations. The sample selection is accomplished using a random method, where 80 percent of the sample is designated for model construction, and the remaining 20 percent is allocated for validation purposes.
Simulation Model CA
Simulations of LULC for the years 2021, 2026, and 2031 were conducted using the cellular automata (CA) algorithm. Cellular automata have demonstrated their ability to accurately predict LULC changes (Gounaridis et al., 2019; Gomes et al., 2019; Kura & Beyene, 2020). The CA model simulation was executed using the Molusce plugin within the QGIS software environment (Zeshan, Mustafa, & Baig, 2021; Avtar et al., 2022; Adam, Masupha, & Xulu, 2023; Baig et al., 2022; Sajan et al., 2022).
Model validation
Model validation is conducted to assess the accuracy of the model in predicting LULC changes. The reference data for the simulation is the LULC information for the year 2021. The model’s accuracy will be evaluated based on several metrics, including the kappa statistic, which encompasses percent of correctness, kappa overall, kappa location, and kappa histogram (Koko et al., 2020; Adam, Masupha, & Xulu, 2023; Baig et al., 2022; Sajan et al., 2022). In addition, evaluation will also be carried out on each LULC class by comparing the actual 2021 LULC and simulated 2021 LULC using precision and recall values. Precision refers to the proportion of correctly predicted instances of a land use class out of all instances predicted as that class. Meanwhile, the proportion of correctly predicted instances of a land use class out of all actual instances of that class. The precision and recall values are calculated using the equation (Sajan et al., 2022; Gündüz, 2025; Mirzakhani, Behzadfar, & Azizi Habashi, 2025):
\[ \text{Precision} = \frac{\text{True Positive (TP)}}{\text{True Positive (TP)} + \text{False Positive (FP)}} \]
\[ \text{Recall} = \frac{\text{True Positive (TP)}}{\text{True Positive (TP)} + \text{False Negative (FN)}} \]
where TP refers to the correct simulated LULC; FP indicates the incorrect simulated LULC as correct; and FN indicates the correct simulated LULC as incorrect (Gündüz, 2025).
3. Result and Discussion
1) Spatial Variable Correlation
Modeling of LULC using various spatial variables often leads to multicollinearity, as noted by Gomes et al. (2019). Multicollinearity should be considered, as it may have a detrimental impact on the model's outcomes, as indicated by Feng et al. (2018). The results of the correlation test conducted among the spatial variables reveal that there is no strong correlation among these spatial variables, as depicted in Table 2. This observation is supported by the correlation coefficients obtained, which only range from -0.028 to 0.507, with the highest coefficient occurring between the DEM variable and the distance from the road variable. Based on these findings, all spatial variables can be considered as factors contributing to LULC changes, as suggested by Marshall et al. (2021). Nevertheless, it is worth noting that this study has not yet analyzed the specific impact of each spatial variable on the transition of individual LULC classes.
Table 2. Correlation matrix
Source: Research finding, 2023
2) LULC change 2011 to 2016
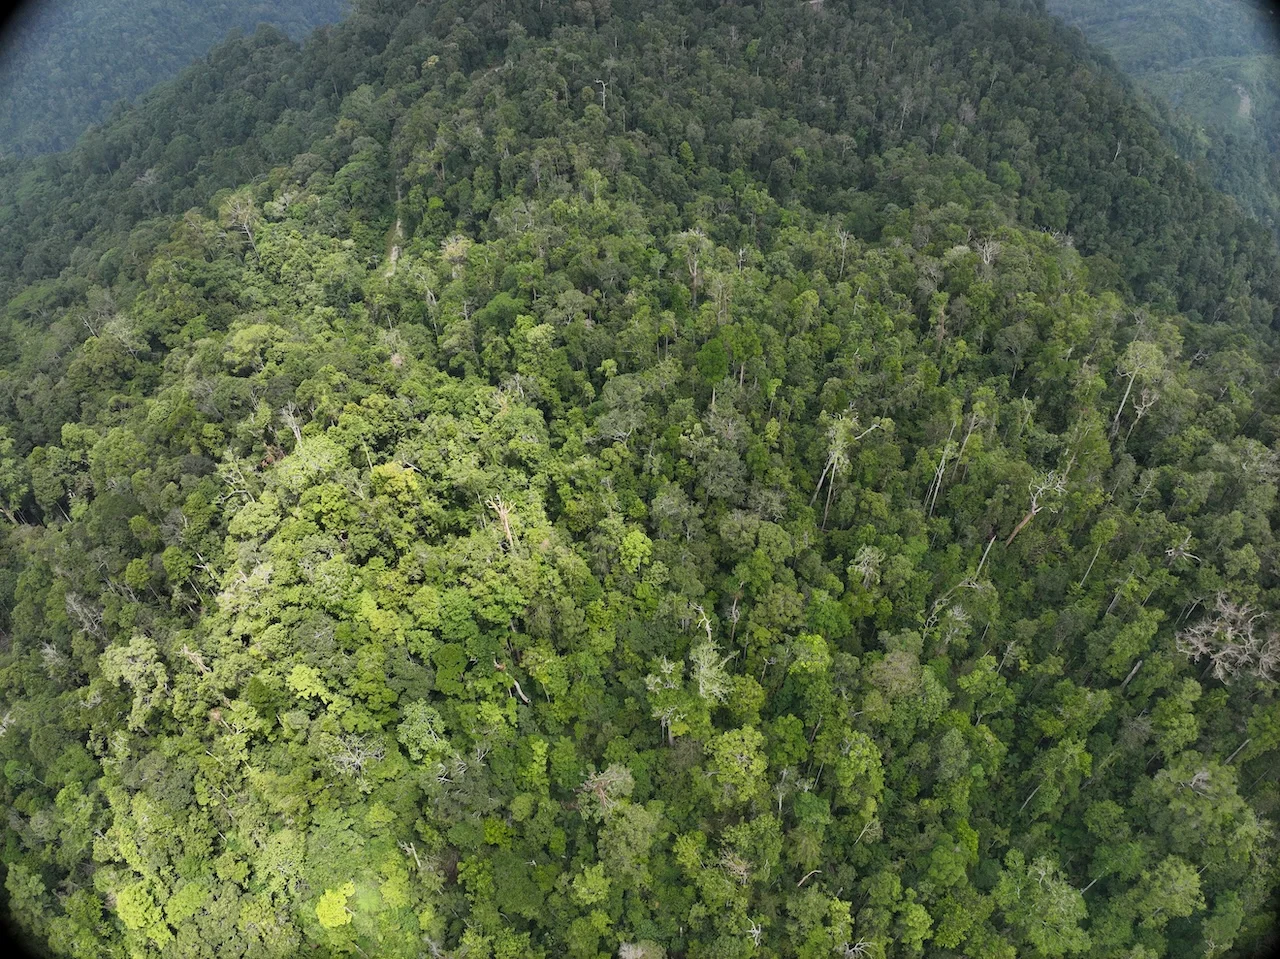
The changes in LULC that transpired between 2011 and 2016 hold substantial significance in shaping the potential transition model. An analysis of the LULC changes reveals that all LULC classes underwent modifications within this 5-year period. The most significant variations were observed in the range-brush category, which decreased by -3.08%, while agriculture increased by 2.51%. Additionally, there were marginal increments in the orchard, rice, residential, and oak forest categories, with changes of 0.10%, 0.47%, 0.14%, and 0.09%, respectively. In contrast, forests and water exhibited the lowest changes, with a minor decrease of -0.05% from the preceding period. Similar results were obtained by Asrianto et al. (2023) using Landsat satellite imagery from 2011–2020, where LULC dynamics of the Mamasa Sub-watershed reported a decrease in forest cover and an increase in agricultural land. For a comprehensive overview of the land use and land cover conditions in the Mamasa Sub-basin from 2011 to 2016, please refer to Table 3.
Table 3. LULC conditions from year 2011 to 2016
Source: Research finding, 2023
3) LULC transition matrix
The transition of LULC from 2011 to 2016 is quantified by assessing the percentage of cells or pixels that either underwent changes or remained unchanged across all LULC classes, as emphasized by Singh et al. (2018). This matrix serves as an indicator of potential transitions for each LULC class within the research site, in line with the insights of Rimal et al. (2017) and Singh et al. (2018). For instance, the range-brush class exhibits a higher rate of change compared to other LULC classes. Only approximately 57.9213% of pixels in this class remained unchanged from 2011 to 2016, with the remainder transitioning into other categories, such as forests (0.0334%), agriculture (41.8973%), rice (0.0645%), water (0.0115%), and oak (0.072%). This condition provides insight into the potential for range-brush to transition into other LULC classes in the future, notably with a 41.8973% potential to become agriculture (Hamad, Balzter, & Kolo, 2018). Conversely, in low transition classes like forests and orchard, a high percentage is projected to remain in the same LULC category, specifically 99.8305% and 100%, respectively. For a comprehensive overview of the potential transition matrix for all LULC classes, please refer to Table 4.
Table 4. Conservation status of birds
Source: Research finding, 2023
4) LULC transition matrix
The transition of LULC from 2011 to 2016 is quantified by assessing the percentage of cells or pixels that either underwent changes or remained unchanged across all LULC classes, as emphasized by Singh et al. (2018). This matrix serves as an indicator of potential transitions for each LULC class within the research site, in line with the insights of Rimal et al. (2017) and Singh et al. (2018). For instance, the range-brush class exhibits a higher rate of change compared to other LULC classes. Only approximately 57.9213% of pixels in this class remained unchanged from 2011 to 2016, with the remainder transitioning into other categories, such as forests (0.0334%), agriculture (41.8973%), rice (0.0645%), water (0.0115%), and oak (0.072%). This condition provides insight into the potential for range-brush to transition into other LULC classes in the future, notably with a 41.8973% potential to become agriculture (Hamad, Balzter, & Kolo, 2018). Conversely, in low transition classes like forests and orchard, a high percentage is projected to remain in the same LULC category, specifically 99.8305% and 100%, respectively. For a comprehensive overview of the potential transition matrix for all LULC classes, please refer to Table 4.
Table 5. LULC transition matrix
Source: Research finding, 2023
5) Validation of LULC simulated
The results of the validation comparing the actual of LULC of 2021 with the simulated LULC of 2021 demonstrate that both model combinations exhibit high values (see Table 5). This suggests that the model is suitable for predicting future LULC patterns (Koko et al., 2020; Adam, Masupha, & Xulu, 2023). The accuracy of the simulation is quantified by the percentage of correctness values for ANN-CA and LR-CA, which are 83.6745 and 82.3498, respectively (Saputra & Lee, 2019). The overall model performance is evaluated based on the overall kappa values of 0.75412 (ANN-CA) and 0.73361 (LR-CA), respectively (Koko et al., 2020; Sajan et al., 2022). The histogram kappa values, representing the quantitative suitability of the model, are 0.88901 and 0.88136, respectively (Lauf et al., 2012). The model's ability to detect location or spatial suitability is assessed based on location kappa values of 0.84827 (ANN-CA) and 0.83236 (LR-CA), respectively (Koko et al., 2020; Sajan et al., 2022). These results also indicate that the ANN-CA model exhibits greater accuracy compared to the LR-CA model.
Table 6.Validation value of ANN–CA and LR–CA model
Source: Research finding, 2023
The model's performance can also be assessed based on the prediction results for each LULC class area, precision and recall. The two combination models used have predicted results that fall below the actual LULC area, particularly in the case of large classes such as forests, range-brush, rice, water, and pasture. In contrast, higher results were obtained for small LULC classes such as wetlands-forested, orchard, residential, and oak. Similar findings have been reported in previous studies on Cellular Automaton (CA)-based LULC simulations, particularly regarding overestimated conditions in small-sized classes (Hamad, Balzter, & Kolo, 2018; Gomes et al., 2019).
The cellular automata model employed in this research exhibits good accuracy in simulating of LULC. However, it is essential to consider several factors that influence the simulation results, such as land potential transitions and spatial variables. In this study, it is noteworthy that the LULC transition from 2011 to 2016 differs significantly from that observed from 2016 to 2021. Meanwhile, the selection of appropriate spatial variables can significantly enhance simulation results. Notably, this study has omitted socio-economic variables, such as population and income levels, as spatial variables, despite their known influence on LULC. A population increase of 1% will increase 0.104% residential as shown by Li et al. (2016). Furthermore, future research is expected to conduct in-depth analyses of the impact of each spatial variable on LULC transitions, as recommended by Gomes et al. (2019). Such analyses would provide valuable insights into the spatial variables that exert the most influence on future LULC change events, including phenomena such as deforestation and land degradation, as discussed by Gounaridis et al. (2019).
6) Future LULC of Mamasa Subwatershed
The simulation results from the two combinations of cellular automata models indicate that LULC in the Mamasa Subwatershed for 2026 and 2031 will continue to experience deforestation and land degradation. This is evident in the declining trend of the forest class, accompanied by a significant increase in rice cultivation (refer to Table 7). A decrease in forest cover could have adverse effects on the hydrological conditions of the Mamasa Subwatershed, as discussed by Anila et al. (2020) and Isra et al. (2023). In response to this issue, there is an urgent need for the rehabilitation of degraded and highly degraded lands to optimize the hydrological function of the Mamasa Subwatershed, as highlighted by Hendraswari et al. (2023). To address this concern, the recommended optimal LULC scenario for the Mamasa subwatershed area, which includes agroforestry, is approximately 63.26 percent, as suggested by Zarghaami et al., 2007. The implementation of agroforestry schemes has proven to be highly effective in soil and water conservation efforts within the Mamasa Subwatershed, as documented by Murtilaksono et al. (2017)
Table 8. LULC simulated for 2026 and 2031
Source: Research finding, 2023
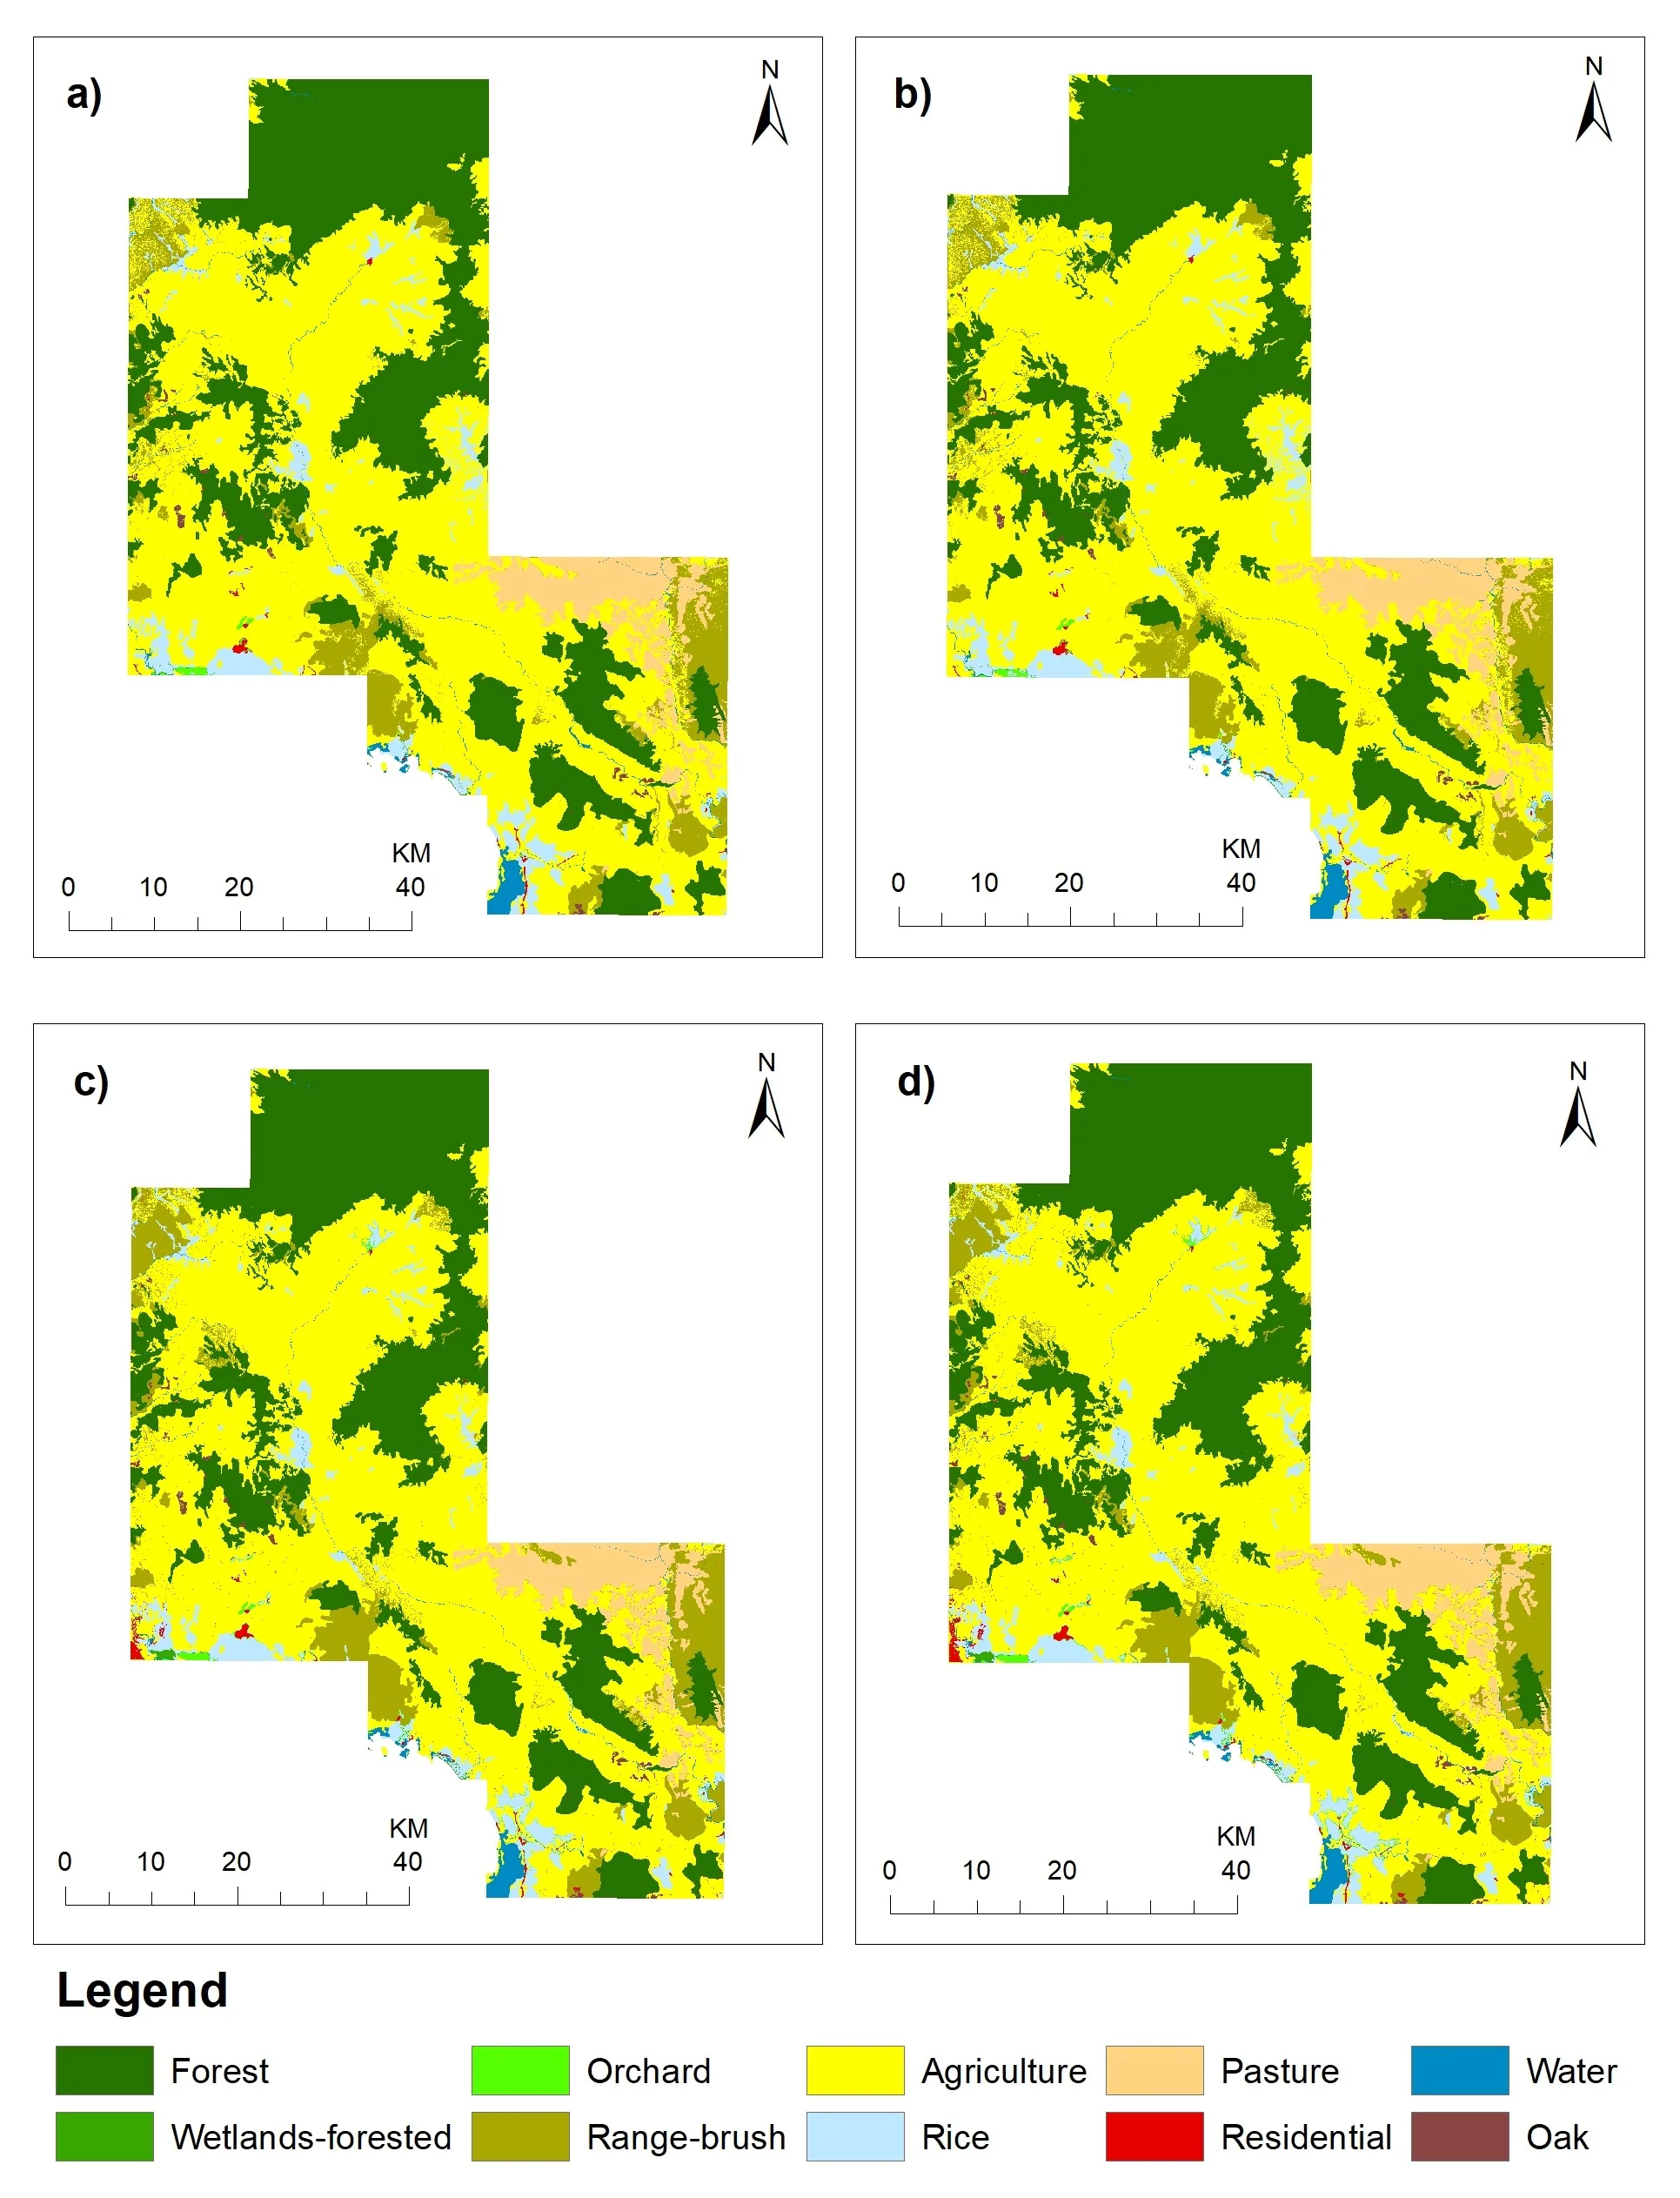
Figure 2. Simulated LULC: a) ANN–CA 2026; b) ANN–CA 2031; c) LR–CA 2026; d) LR–CA 2031
When considering the changes in LULC area from 2026 to 2031, it's evident that the LR-CA model exhibits more significant changes compared to the simulated results of the ANN-CA model. For instance, the reduction in forest area in the ANN-CA model from 2026 to 2031 is 3.69 hectares, while in the LR-CA model, it amounts to 12.06 hectares. This pattern is consistent across all LULC classes. This distinction can be instrumental in selecting a model based on the desired planning scenario, whether it involves a pessimistic or optimistic outlook, such as scenarios related to deforestation and land degradation (Fonseca et al., 2022). The LR-CA model can be employed as a pessimistic scenario to simulate future LULC trends, whereas the ANN-CA model can serve as an alternative optimistic scenario (Shabani et al., 2022; Niya et al., 2020). Simulations of LULC under various scenarios are imperative for decision-makers, as emphasized by Liu et al. (2017). A visual representation of the LULC simulation results for 2026 and 2031 is provided in Figure 2.
4. Conclusion
We simulated of LULC in the Mamasa Sub watershed based on machine learning algorithms using two model combination. The ANN-CA model exhibits % of correctness and an overall kappa of 83.6745 and 0.75412, respectively, surpassing the percent of correctness and overall kappa of the LR-CA model, which are 82.3498 and 0.73361, respectively. However, it's important to note that the prediction results of both model combinations still fall below the actual LULC values, especially in the case of large LULC classes such as forests, range-shrub, rice, and pasture. Conversely, higher accuracy is observed for smaller classes such as wetlands-forested, orchard, residential, and oak. The simulation results show that there will still be a decrease in forest cover and a significant increase in agricultural land in the Mamasa Sub watershed in 2026 and 2031. The decrease in forest cover and increase in agricultural land in the future will further impact hydrological conditions. This could reduce the benefits provided by the Mamasa Sub watershed, such as the disruption of the Bakaru Hydroelectric Power Plant's water supply. Therefore, policy makers must take appropriate and timely management actions to protect the Mamasa Sub watershed from the impacts of these land use and cover changes. It's worth highlighting that our study has not incorporated several socio-economic variables, such as population size and income levels. Future research is expected to analyse the influence of each variable and include some socio-economic variables that may have a significant influence on LULC change.
5. Author Contributions
The first author (WUA) contributed as compiler and data analyst based on the research results. The second author (II) contributed methods to help interpret data and research results, the third author (NHAS) contributed methods to help interpret data, and the fourth author (RR) contributed to article preparation.
6. Competing Interests
All authors declare no conflicts of interest regarding this publication.
7. Acknowledgements
We would like to thank LPPM Universitas Sulawesi Barat, for funding this research We would also like to thank PLTA Bakaru for supporting this research.
8. References
Li, X., Wang, Y., Li, J., & others. (2016). Physical and socioeconomic driving forces of land‐use and land‐cover changes: A case study of Wuhan City, China. Discrete Dynamics in Nature and Society, 2016, 1–11. https://doi.org/10.1155/2016/8061069
الحقوق الفكرية (c) 2025 Jurnal Wasian

هذا العمل مرخص بموجب Creative Commons Attribution 4.0 International License.
Copyright and License
All articles published in Wasian Journal are the property of the authors. By submitting an article to Wasian Journal, authors agree to the following terms:
-
Copyright Ownership: The author(s) retain copyright and full publishing rights without restrictions. Authors grant the journal the right to publish the work first and to distribute it as open access under a Creative Commons Attribution 4.0 International License (CC BY 4.0).
-
Licensing: Articles published in Wasian Journal are licensed under a Creative Commons Attribution 4.0 International License (CC BY 4.0). This license allows others to share, copy, and redistribute the material in any medium or format, and adapt, remix, transform, and build upon the material for any purpose, even commercially, provided that proper credit is given to the original author(s) and the source of the material

This work is licensed under a Creative Commons Attribution 4.0 International License. -
Author's Rights: Authors are permitted and encouraged to post their work online (e.g., in institutional repositories or on their website) prior to and during the submission process, as it can lead to productive exchanges and greater citation of published work.
-
Third-Party Content: If your article contains material (e.g., images, tables, or figures) for which you do not hold copyright, you must obtain permission from the copyright holder to use the material in your article. This permission must include the right for you to grant the journal the rights described above.
-
Reprints and Distribution: Authors have the right to distribute the final published version of their work (e.g., post it to an institutional repository or publish it in a book), provided that the original publication in Wasian Journal is acknowledged.
For the reader you are free to:
- Share — copy and redistribute the material in any medium or format for any purpose, even commercially.
- Adapt — remix, transform, and build upon the material for any purpose, even commercially.
- The licensor cannot revoke these freedoms as long as you follow the license terms.
Under the following terms:
- Attribution — You must give appropriate credit , provide a link to the license, and indicate if changes were made . You may do so in any reasonable manner, but not in any way that suggests the licensor endorses you or your use.
- No additional restrictions — You may not apply legal terms or technological measures that legally restrict others from doing anything the license permits.
Notices:
You do not have to comply with the license for elements of the material in the public domain or where your use is permitted by an applicable exception or limitation .
No warranties are given. The license may not give you all of the permissions necessary for your intended use. For example, other rights such as publicity, privacy, or moral rightsmay limit how you use the material.

الأعمال الأكثر قراءة لنفس المؤلف/المؤلفين
- Irlan Irlan, Ulfa Adzkia, Suhartono Suhartono, Meliani Meliani, Alpri Sri Jenos, Teguh Bimantara, Chairil A, Individual Tree Segmentation in TropicalNatural Forest Based on Point CloudGenerated from UAV RGB Image , Jurnal Wasian: مجلد 12 عدد 02 (2025): December
- Andi Mawaddah Zakiyah, Rini Pratiwi, Astina Astina, Widyanti Utami A, Unequal Value Capture in Non-TimberForest Product Chains with Evidence fromPine Resin Processing in Rural Indonesia , Jurnal Wasian: مجلد 13 عدد 01 (2026): June