1.
Introduction
Way
Kambas National Park (WKNP) was designated as the Way Kambas
National Park Office pursuant to Decree of the Minister of Forestry
No. 185/Kpts-II/1997 dated March 13, 1997. Previously, the region
had suffered damage due to timber exploitation, which converted
large portions of the forest into cogon grass, shrubs, and secondary
forest. Despite these conditions, this region has a diversity of
habitat types that support the existence of various wildlife species
(Yunus
et al. 2019),
and makes this area an important location for the protection of
mandated species that have high conservation value, including the
Malayan tapir (Tapirus
indicus).
Currently, Malayan tapirs are classified as Endangered by the
International Union for Conservation of Nature (IUCN), listed in
Appendix I of the Convention on International Trade in Endangered
Species of Wild Fauna and Flora (CITES), and legally protected under
the Ministry of Environment and Forestry Regulation No.
P.106/MENLHK/SETJEN/KUM.1/12/2018 on Protected Plant and Animal
Species. Regulation of the Minister of Forestry Number
P.57/Menhut-II/2008 concerning the Strategic National Species
Conservation 2008-2018 stipulates that the Malayan tapir are
priority animals for conservation (Anwar
et al. 2023).
According to the Malayan Tapir Conservation Strategy and Action Plan
for the period 2013–2022, their density is estimated to range from
0.3 to 0.8 individuals per km² (Laia
2021).
Various anthropogenic pressures, including habitat degradation,
illegal hunting, and the wildlife trade, continue to drive the
decline in Malayan tapir populations, which has the potential to
disrupt ecosystem balance due to the Malayan tapir’s ecological
role as a seed disperser (Maharani
2019).
Active
conservation efforts for Malayan tapirs are necessary to mitigate
their dwindling populations and have already been implemented both
in situ and ex situ. The availability of natural food for Malayan
tapirs is one of the factors in determining its habitat (Samantha
et al. 2020).
As herbivores, the Malayan tapir is an animal that is highly
dependent on the diversity of forest vegetation to meet its
nutritional needs. This indicates that the quality of Malayan tapir
habitats is determined not only by the area’s size but also by the
availability and distribution of forage within their habitats.
Distribution patterns are quantitative parameters that describe the
presence of a species in horizontal space and reflect the relative
spatial arrangement of a species in relation to other species, which
are influenced by environmental factors and biological
characteristics. The distribution patterns of Malayan tapir forage
typically follow random, uniform, and clumped patterns (Setiarno
et al. 2025).
This study aims to identify Malayan tapir forage in WKNP, assess
distribution patterns of Malayan tapir forage in WKNP, and analyze
the diet of Malayan tapir within WKNP. This study differs from
previous studies in that it provides the latest information on
composition and distribution of Malayan tapir forage in WKNP, while
also conducting proximate analysis to determine the nutritional
content of Malayan tapir diet. Ultimately, this study can provide an
empirical basis for WKNP to design targeted habitat restoration
strategies for nutrient management for Malayan tapir conservation.
2.
Method
1)
Time
and Location
The
research was conducted at the Rawa Bunder Resort in Way Kambas
National Park from February to March 2026. Rawa Bunder Resort
is a land restoration area with three types of habitats, which
include swamp forest, tropical lowland forest, and grassland. The
geographical location of WKNP is between 4˚37’S and 5˚16’S and
between 105˚33’E and 105˚54’E. Administratively, WKNP spans
across East Lampung Regency and Central Lampung Regency. This area
has a flat to slightly undulating topography with an elevation
ranging from 0 to 50 meters above sea level and a tropical climate
with an average rainfall of 3000 mm/year (Yunus
et al. 2019).
Data collection was conducted from 8:00 AM to 3:00 PM. The detailed
map of study site is presented in Figure 1.
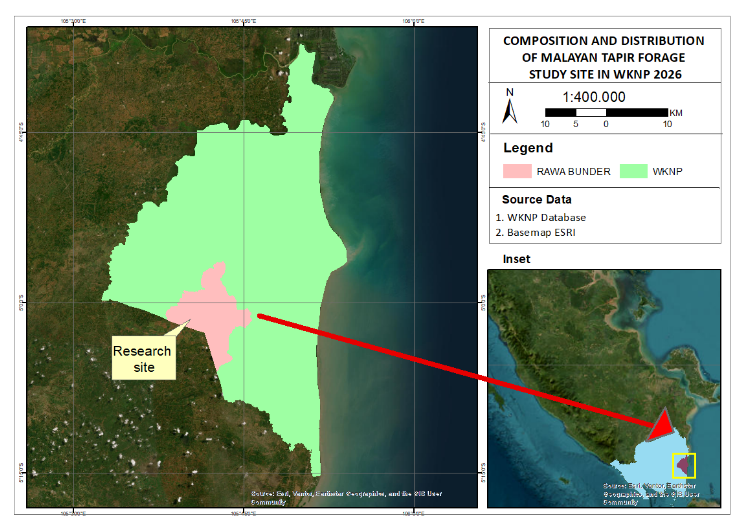
Figure
1. Detailed map of study
site
The
tools used in this research included field maps, smartphone, laptop,
Avenza
Maps, rope, measuring tape, ruler, ArcGIS, phi band, Microsoft
Excel, PlantNet, plastic bags, and writing materials. The subject of
this observation was Malayan tapir forage.
2)
Data
Collection and Analysis Used
Data
collected in this study include primary and secondary data. Primary
data were obtained through vegetation observation and analysis.
Secondary data were obtained through literature reviews, satellite
imagery, and data from the WKNP office. Vegetation analysis was
conducted to determine the species composition and distribution of
Malayan tapir forage using a grid method with 20 m × 20 m plots
spaced 100 m apart, comprising a total of 50 plots divided into 5
transects by determining the plot using the purposive sampling
method with looking at signs of the presence of tapirs such as
feeding traces, footprints, and feces. The vegetation inventory was
categorized into four growth stages, namely trees (20 m × 20 m),
poles (10 m × 10 m), saplings (5 m × 5 m), and undergrowth (2 m ×
2 m). For each type of Malayan tapir forage, leaf samples weighing
0.5 kg were collected to determine the diet. The diet was analyzed
using the proximate analysis method at the Feed Science and
Technology Laboratory, Department of Nutrition and Feed Technology,
Faculty of Animal Science, IPB University. The design of the line
transects with grid method sampling plot by Kusmana
(1997)
used for vegetation analysis is illustrated in figure 2.
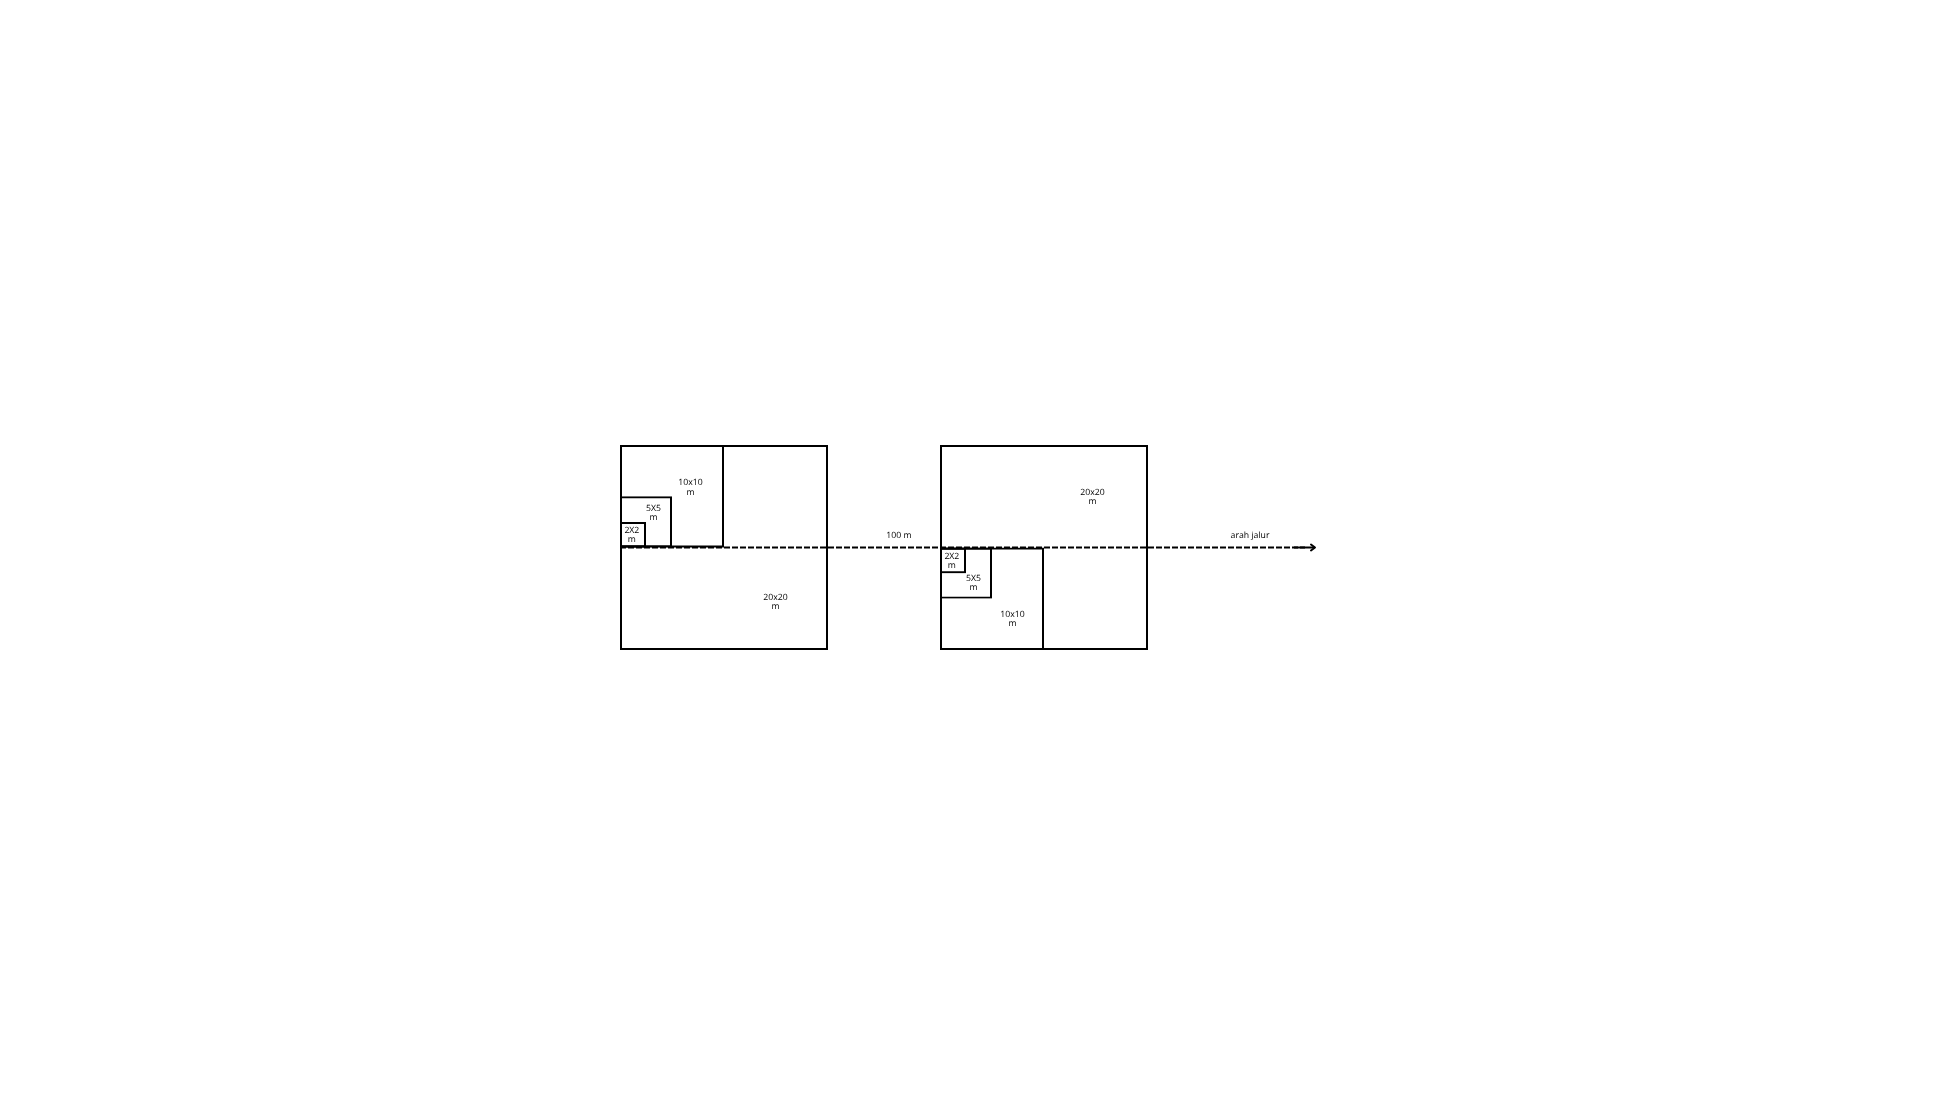
Figure
2. The design of the line
transects with grid method sampling plot used for vegetation
analysis
3)
Analysis
of the Composition of Malayan Tapir Forage
Analysis
of Malayan tapir forage was conducted to describe the composition
categorized by plant growth forms, including herbs, shrubs, tall
herbs, and trees. The calculation of the Importance Value Index
(IVI) was performed using the formula by Kusmana
(1997),
as follows:
De
(
=
(1)
RDe
(
=
x 100 % (2)
F
(%) =
(3)
RF
(%) =
x 100% (4)
(5)
RD
(%) =
x 100% (6)
The
IVI for saplings and undergrowth is calculated using the formula
IVI
(%) = Relative density + Relative dominance (7)
The
IVI for poles and trees is calculated using the formula:
IVI
(%) = Relative density + Relative dominance + Relative frequency (8)
Information:
De =
Density
RDe =
Relative Density
F =
Frequency
RF =
Relative Frequency
D =
Dominance
RD =
Relative Dominance
The
diversity index is determined using the Shannon-Wiener formula
(Magurran
2004),
as follows:
(9)
Remarks:
ni = number of individual species; N = total number of individuals
of all species; H’= Shannon-Wiener index formula; Pi = proportion
of individual species.
The
evenness index is determined using the Pielou evenness index formula
(Magurran
2004),
as follows:
(10)
Remarks:
E = Pielou evenness index formula; H’= Shannon-Wiener index
formula; S = total number of species found
The
richness index is calculated using Margalef’s formula (Magurran
2004)
as follows:
(11)
Remarks:
S = total number of species found; N = total number of individuals
of all species; R = Margalef richness index.
4)
Research
Instrument and Data Collection
The
index used to describe the distribution pattern is the Morisita
index. The distribution pattern of Malayan tapir forage was analyzed
using the formula by Krebs (1989), as follows:
(12)
Remarks:
n = Number of plots; N = Total number of individuals of all species;
∑x = Total number of individuals in the plots.
3.
Result
and Discussion
1)
Habitat
Characteristics of Malayan Tapir
Way
Kambas National Park is one of Indonesia’s conservation areas
located in East Lampung Regency, Lampung and covering an area of
125,621.30 hectares. WKNP was established as the Way Kambas National
Park Office pursuant to Decree of the Minister of Forestry No.
185/Kpts-II/1997 dated March 13, 1997. The region is drained by
several watershed (DAS) and sub-DAS such as Rawa
Kambas, Rawa Penet, Seputih, Way Jepara, Way Kambas, Way Kapuk, and
Way Sekopong.
The presence of lowland forest and swamp forest ecosystems in WKNP
serves as a key factor in supporting the habitat carrying capacity
for endangered species, including the Malayan tapir, particularly by
providing food sources and shelter.
Evidence
of Malayan tapir habitat at the Rawa Bunder resort includes feeding
traces, footprints, feces, and wallows. All footprints found were
located in the secondary forest, specifically at the forest edge in
close proximity to areas with high human activity. Although abundant
tapir tracks are found on the forest edges, these findings cannot
confirm that tapirs are undisturbed by human activities. Anwar
et al. (2023)
explained that tapirs are crepuscular animals that actively forage
from sunset and rest during the day. This indicates that tapirs
cross the forest edge area during their active period, specifically
from afternoon through the night. This species is recorded as having
a high level of adaptation to various types of habitats with a large
home range, but it tends to choose areas far from disturbance if
given the choice (Samantha
et al. 2020).
The observations were conducted in February–March, when rainfall
is still frequent. During this time, the observation areas where
abundant tapir traces were recorded maintained an average
temperature of 31.7°C. Malayan tapir feces were discovered only at
the forest edge in clumped patterns. Other traces, such as
footprints and foraging Remains, were distributed at the forest edge
and near swamps. Inactive Malayan tapir wallow was found in swampy
areas adjacent to permanent water sources.
2)
Composition
of Malayan Tapir Forage
The
composition of Malayan tapir forage identified during the
observations include 33 species from 25 families. These forage
plants comprised growth forms, such as shrubs, herbs, and trees, the
tree heavily dominates with a percentage of 55%. Detailed data
detailing on vernacular name, scientific name, families, growth
forms, and specific plant part consumed are presented in Table 1.
One of the habitat characteristics required by Malayan tapirs is the
availability of forage. Forage refers to any substances that have
the potential to be consumed by Malayan tapirs and provide benefits
to them (Datta
2023).
This species consumes 4-5% of its body weight in food to meet its
daily nutritional needs (Sjahfirdi
& Ananda 2023).
Table
1.
Detailed
data detailing on vernacular name, scientific name, families, growth
forms, and specific plant part consumed

Vernacular
name
|
Scientific
name
|
Family
|
Growth
form
|
Plant
parts consumed
|
Alang-alang
|
Imperata
cylindrica
|
Poaceae
|
Herb
|
Leaf,
branch
|
Bayur
|
Pterospermum
diversifolium
|
Malvaceae
|
Tree
|
Leaf,
shoots, small twigs
|
Berasan
|
Symplocos
stenosepala
|
Symplocaceae
|
Tree
|
Leaf,
small twigs
|
Blimbingan
|
Rourea
minor
|
Connaraceae
|
Tree
|
Leaf,
small twigs, fruit
|
Cincauan
|
Cyclea
barbata
|
Menispermaceae
|
Liana
|
Leaf
|
Gaharu
|
Aquilaria
malaccensis
|
Thymelaeaceae
|
Tree
|
Leaf,
small twigs
|
Jambon
|
Syzygium
sp.
|
Myrtaceae
|
Tree
|
Leaf,
small twigs, fruit
|
Kalopo
|
Calopogonium
mucunoides
|
Fabaceae
|
Herb
|
Leaf
|
Karetan
|
Hevea
brasiliense
|
Euphorbiaceae
|
Tree
|
Leaf
|
Keladi
|
Caladium
sp.
|
Araceae
|
Herb
|
Leaf
|
Kelandri
|
Eurya
nitida Korth.
|
Mimosaceae
|
Shrub
|
Leaf,
shoots, small twigs
|
Ki
teja
|
Cinnamomum
iners
|
Lauraceae
|
Tree
|
Leaf,
small twigs
|
Kopian
|
Ixora glume
|
Rubiaceae
|
Tree
|
Leaf,
small twigs
|
Krakas
|
Helicia
sp.
|
Proteaceae
|
Shrub
|
Leaf,
small twigs
|
Laban
|
Vitex sp.
|
Lamiaceae
|
Tree
|
Leaf,
small twigs, fruit
|
Medang
|
Aporosa
confusa
|
Euphorbiaceae
|
Tree
|
Leaf,
small twigs
|
Meniran
|
Xanthophyllum
flavescens
|
Polygalaceae
|
Shrub
|
Leaf,
small twigs
|
Mundu
|
Garcinia
nervosa
|
Clusiaceae
|
Tree
|
Leaf,
small twigs, fruit
|
Paku
hata
|
lygodium
circinatum
|
Schizaeaceae
|
Liana
|
Leaf
|
Paku
rambat
|
Lygodium
sp
|
Schizaeaceae
|
Liana
|
Leaf
|
Pelangas
|
Aporosa
octandra
|
Phyllanthaceae
|
Tree
|
Leaf,
shoots, small twigs
|
Pulai
|
Alstonia
scholaris
|
Apocynaceae
|
Tree
|
Leaf,
small twigs
|
Rambutan
|
Nephelium
lappaceum
|
Sapindaceae
|
Tree
|
Fruit
|
Rumput
gajah
|
pennisetum
purpureum
|
Poaceae
|
Herb
|
Leaf
|
Rumput
paitan
|
Paspalum
conjugatum
|
Poaceae
|
Herb
|
Leaf
|
Rumput
teki
|
Cyperus
rotundus
|
Cyperaceae
|
Herb
|
Leaf
|
Salam
|
Syzygium
polyanthum
|
Myrtaceae
|
Tree
|
Leaf,
small twigs
|
Sempu
air
|
D.
excelsa
|
Dilleniaceae
|
Tree
|
Leaf,
small twigs
|
Senggani
|
Melastoma
malabathricum
|
Melastomaceae
|
Shrub
|
Leaf,
small twigs, fruit
|
Soka
|
Ixora
sp.
|
Rubiaceae
|
Shrub
|
Leaf,
small twigs
|
Sulangkar
|
Leea
indica Merr. (leeea)
|
Vitaceae
|
Shrub
|
Leaf,
small twigs
|
Tiga
urat
|
Neolitsea
zeylanica
|
Lauraceae
|
Tree
|
Leaf,
small twigs
|
Waru
|
Hibiscus
tiliaceus
|
Malvaceae
|
Tree
|
Leaf,
shoots, small twigs
|
The
most commonly consumed forage parts are leaves, particularly young
leaves. The determination of these forages was based on the
identification of feeding signs in the field, which were then
validated through interviews and literature reviews for species that
did not show direct physical signs during observation. The
determination of the plant parts consumed was based on field
findings and literature studies. Malayan tapirs typically consume
foliage, shoots, small twigs, and branches, and very rarely chew on
bark. Additionally, Malayan tapirs also consume fallen fruits found
on the forest floor (Simpson
et al. 2013).
Field observations revealed Malayan tapir feeding signs consisting
of leaves, stems, and fruits. Fruit consumption was indicated by
fruit remains in Malayan tapir feces, which consisted only of intact
seeds, as shown in Figure 3. Malayan tapir feces containing seeds
were found in only 1 out of 8 fecal boluses, indicating that Malayan
tapirs consume significantly more leaves and twigs than fruit. The
presence of seeds in the feces confirms the role of the Malayan
tapir as a seed disperser. This aligns with Sjahfirdi
and Ananda (2023),
who stated that the Malayan tapir serves as an effective seed
disperser in forests, with its feces containing seeds from consumed
fruits. The data collection conducted in February–March may have
influenced the lower observed consumption levels of fruits,
relatives to leaves, and stems.
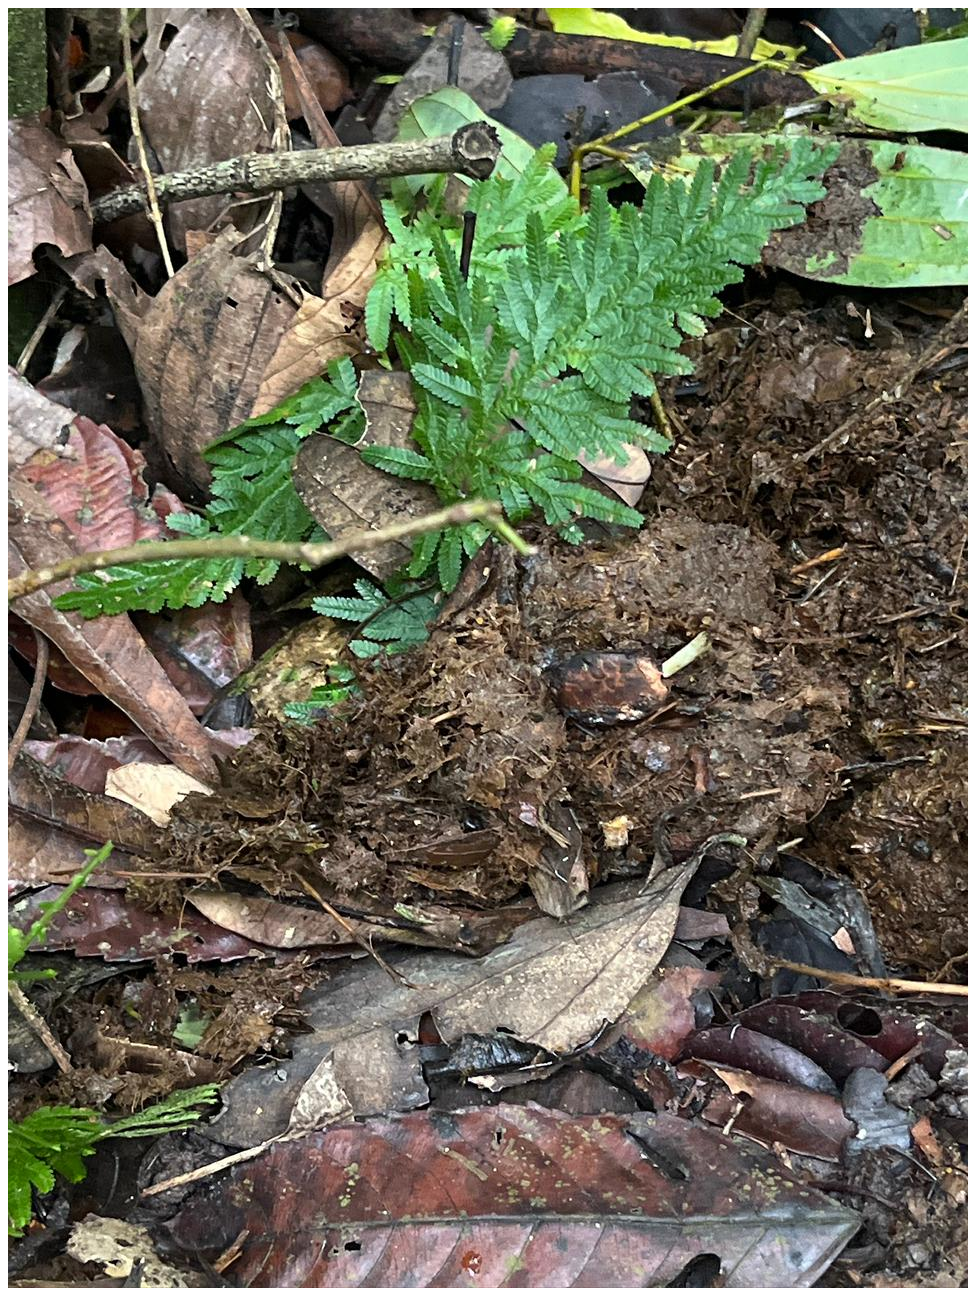
Figure
3. Intact seed documented
within Malayan tapir feces.
The
Malayan tapir is the herbivore with a digestive system similar to
that of a horse, classifying it as a hindgut fermenter. Malayan
tapirs are not ruminants, and they have food-processing microbes
located in the rear section of their digestive tract. Consequently,
Malayan tapirs are known to be quite selective in their forage
(Simpson
et al. 2013).
During the observation, many saplings were found to have been
uprooted by Malayan tapirs to access the shoots, as shown in Figure
4. This aligns with Simpson
(2013),
who noted that Malayan tapirs occasionally uproot and break small
trees to obtain leaves and branches, with feeding traces often
discovered at heights of 0.8–1.2 m. Scratch marks were observed on
the lower part of the trunk of these felled trees. Broken branches
with the marks, indicate the physical effort made by the Malayan
tapir access its forage. This behavior is consistent with Williams
and Petrides (1980),
who found that Malayan tapirs topple small trees by placing their
feet on the trunk and stepping on it to lower the canopy.
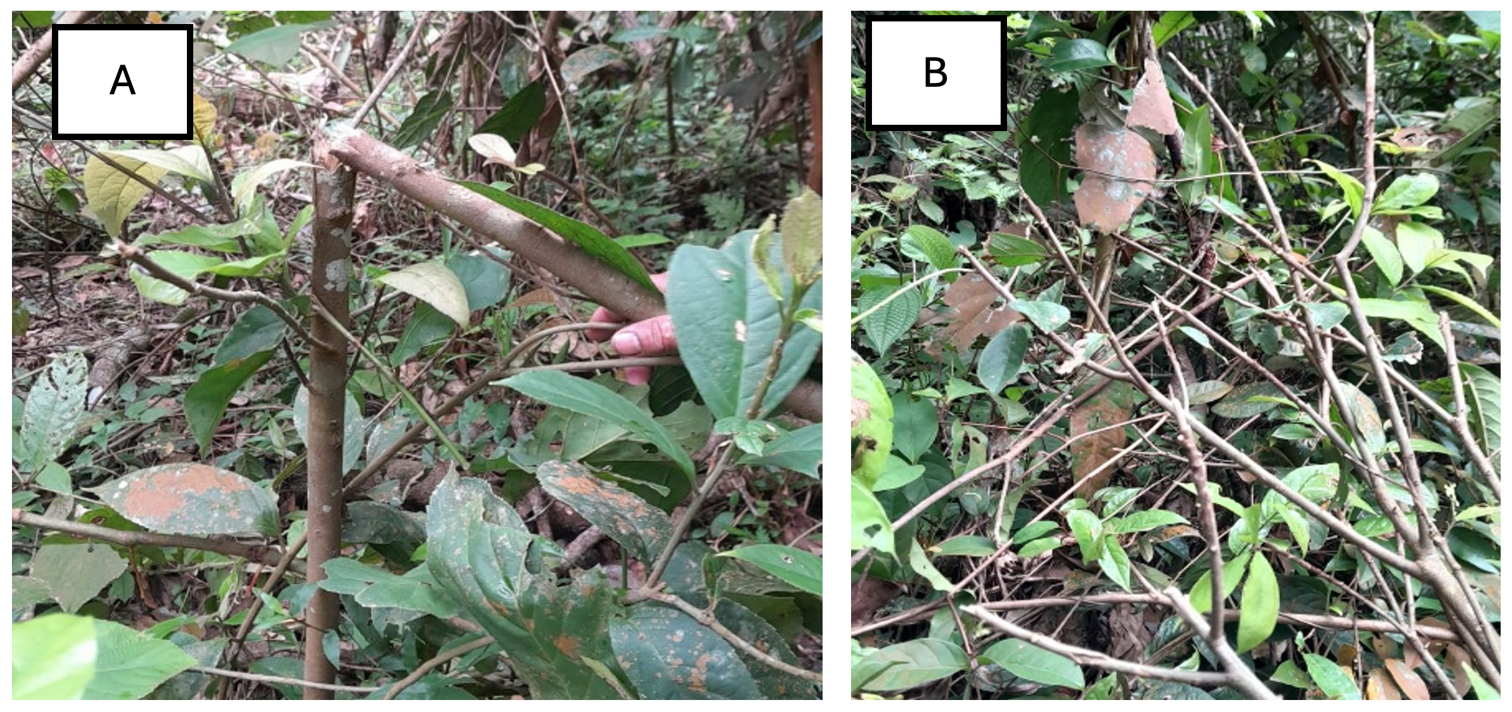
Figure
4. Forage plants knocked
down by Malayan tapir: (a) sapling, (b) branch
Malayan
tapirs inhabit various types of lowland vegetation and particularly
near water sources. Malayan tapirs generally correlate with water
bodies, where most of their active time occurs, such as for
foraging. Malayan tapirs may reduce their home range during the dry
season to remain close to water sources (Samantha
et al. 2020).
This finding is consistent with Anwar
et al. (2023),
who classified Malayan tapirs as water-dependent species because
water is essential for digestion. This observation was conducted
across two types of vegetation, which include scrubland and
secondary forest. Data of Distribution of Malayan tapir forage
species across different vegetation types are presented at table 2.
Table
2.
Distribution
of Malayan tapir forage species across different vegetation types.
Vernacular
name
|
Types
of vegetation
|
Secondary
Forest
|
Scrubland
|
Alang
alang
|
|
✓
|
Bayur
|
✓
|
|
Berasan
|
✓
|
✓
|
Blimbingan
|
✓
|
|
Cincauan
|
✓
|
|
Gaharu
|
✓
|
|
Jambon
|
✓
|
✓
|
Kalopo
|
|
✓
|
Karetan
|
✓
|
|
Keladi
|
✓
|
|
Kelandri
|
|
✓
|
Ki
teja
|
✓
|
|
Kopian
|
✓
|
|
Krakas
|
✓
|
|
Laban
|
✓
|
|
Medang
|
✓
|
|
Meniran
|
✓
|
|
Mundu
|
✓
|
|
Paku
hata
|
|
✓
|
Paku
rambat
|
|
✓
|
Pelangas
|
✓
|
|
Pulai
|
✓
|
|
Rambutan
|
✓
|
|
Rumput
gajah
|
|
✓
|
Rumput
paitan
|
✓
|
|
Rumput
teki
|
✓
|
|
Salam
|
✓
|
✓
|
Sempu
air
|
✓
|
|
Senggani
|
|
✓
|
Soka
|
✓
|
|
Sulangkar
|
✓
|
|
Tiga
urat
|
✓
|
|
Waru
|
✓
|
|
The
Malayan tapir forage species were commonly found in secondary
forests, namely 23 species, followed by 7 species found in
shrubbery, and 3 species found across both type of vegetation.
Feeding sign of Malayan tapir remains and activity traces were
strictly observed in the secondary forests, with not found in the
shrubbery areas. Malayan tapirs frequently go to the forest edge to
eat and returning to the forest to rest. One of the highly consumed
plant species with abundance feeding remains discovered during the
observation is senggani. Although, Malayan tapir feeding traces are
predominantly concentrated in secondary forest, open grasslands also
provide sufficient forage. Malayan tapirs have a wide home range,
allowing them to forage as far as grasslands if forage in the forest
becomes scarce. Malayan tapirs generally prefer secondary forests,
especially for foraging because there are many young stems due to
the availability of light (Setiarno
et al. 2025).
Cogon grass that has very little shade can be a factor in less
Malayan tapir activity compared to secondary forests. Continuous
availability of spesies at various growth stages, indicates that the
Rawa Bunder Resort provides forage availability and habitat carrying
capacity for the Malayan tapir population.
The
Importance Value Index (IVI) for Malayan tapir forage indicates the
diversity of plant growth stage that contribute to meeting their
dietary needs. The density of Malayan tapir forage resources also
indicates the abundance of each species. High density values in the
forage are highly beneficial for Malayan tapirs because this
vegetation is easily accessible. Data on The Importance Value Index
for the forage species are presented in Table 3.
Table
3.
The Importance Value Index for the Malayan tapir forage across
various growth stages
Growth
stage
|
Vernacular
name
|
Scientific
name
|
Family
|
IVI
(%)
|
Undergrowth
|
Alang-alang
|
Imperata
cylindrica
|
Poaceae
|
66.96
|
|
Soka
|
Ixora
sp.
|
Rubiaceae
|
19.55
|
|
Senggani
|
Melastoma
malabathricum
|
Melastomaceae
|
14.57
|
Sapling
|
Berasan
|
Symplocos
stenosepala
|
Symplocaceae
|
41.22
|
|
Jambon
|
Syzygium
sp.
|
Myrtaceae
|
36.06
|
|
Soka
|
Ixora
sp.
|
Rubiaceae
|
36.06
|
Pole
|
Berasan
|
Symplocos
stenosepala
|
Symplocaceae
|
107.69
|
|
Jambon
|
Syzygium
sp.
|
Myrtaceae
|
12.91
|
|
Rambutan
|
Nephelium
lappaceum
|
Sapindaceae
|
12.91
|
Tree
|
Berasan
|
Symplocos
stenosepala
|
Symplocaceae
|
77.16
|
|
Rambutan
|
Nephelium
lappaceum
|
Sapindaceae
|
34.06
|
|
Laban
|
Vitex sp.
|
Lamiaceae
|
29.80
|
Based
on Table 3 above, alang-alang
is the Malayan tapir forage with the highest IVI of 66.96%. Soka
ranks second with an IVI of 19.55%. The high forage density at the
lower vegetation level increases the foraging efficiency of Malayan
tapirs in meeting their daily nutritional needs. The absence of
feeding residues indicate that Malayan tapir consumed the
undergrowth vegetation entirely. In accordance with Simpson
(2013),
which shows that megaherbivores such as Malayan tapirs tend to
consume on ground-level vegetation without leaving any residue. High
density is beneficial for Malayan tapirs to forage efficiently
without traveling long distances. As the lowest plant stratum, the
functions and roles of undergrowth vegetation include acting as
ground cover to enrich soil organic matter, as well as retaining
rainwater and reducing surface runoff to minimize erosion (Putri
et al. 2024).
Undergrowth vegetation is highly dependent on light and thus tends
to grow more in open areas. This aligns with Rahawarin et al.
(2025), who noted that light and shade are among the most
influential environmental conditions affecting the growth of
understory vegetation.
At
the sapling stage, berasan
exhibited the highest value with an IVI of 41.22%. Other dominant
Malayan tapirs forage followed by jambon and soka, each with an IVI
of 36.06%. Consistent with the study by Damayanti et al. (2016), who
previously noted berasan
as the dominant species at the sapling stage with an IVI of 38.97%.
Berasan
is an endemic species and dominates lowland rainforests in WKNP. At
the pole stage, the dominant food source for Malayan tapirs is
berasan,
with an IVI of 107.69%. This high value confirms that berasan
is the most abundant forage at Rawa Bunder Resort. The pole stage
refers to the phase with a diameter of 10–19.9 cm. During
observations, the trunk level was not frequently encountered due to
the dense tree canopy and the abundance of seedlings and understory
vegetation, resulting in lower productivity. According to Damayanti
et al. (2016),
the dominance of a species is attributed to its ability to utilize a
larger share of available resources compared to other species. At
the tree level presented in Table 3, the berasan
species dominates with an IVI of 77,16%. Other dominant forage
species include rambutan with an IVI of 34.06% and laban
with an IVI of 29.80%. The presence of these species at the tree
level is crucial as providers of fruit-based forage during the
fruiting season and plays a significant role in seed dispersal with
a dense stand of forage trees, Malayan tapirs will find it easier to
forage.
The
consistent dominance of berasan
at the level of saplings, poles, and trees indicates that this
species can be the main supply whose stability is maintained. The
existence of a tree with a large diameter can provide a canopy that
Malayan tapirs can use as a resting place. The availability of
abundant trees with a DBH of 5-45 cm and a DBH of more than 45 cm is
one of the important factors that affect the existence of Malayan
tapir. This can be due to large trees that have an important role in
providing habitat and food sources for Malayan tapirs (Samantha
et al. 2020).
Species
diversity, species evenness, and species richness indices illustrate
the abundance of Malayan tapir forage in the vegetation of WKNP. The
highest species diversity and evenness indices were observed in the
sapling layer, while the highest species richness index was observed
in the undergrowth layer. The diversity, evenness, and richness
indices are presented in Table 4.
Table
4.
The
diversity, evenness, and richness indices in every growth stage of
the Malayan tapir forage in rawa bunder resort
Growth
stage
|
H
|
E
|
R
|
Undergrowth
|
1.728
|
0.510
|
3.848
|
Sapling
|
2.047
|
0.824
|
2.340
|
Pole
|
1.692
|
0.660
|
3.037
|
Tree
|
1.767
|
0.737
|
2.495
|
Remarks:
H = Species diversity index; E = Species evenness index; R = Species
richness index
According
to the established criteria, the diversity values across all
vegetation levels fall into the moderate category. The higher
diversity index reflects the greater number of species, indicating
that the Malayan tapir’s diet remains highly diverse and ensure a
steady forage supply. High species diversity indicates that the
ecological function of an ecosystem is still stable (Setiarno
et al. 2025).
The evenness index shown in Table 4 indicates that all vegetation
levels fall into the high category except undergrowth layer. The
species evenness index shows the degree of equality of individual
abundance in each species. The small value of equality can be caused
by the presence of dominant species in a community (Baderan
et al. 2021).
Based on Table 4, the species richness index values for all
vegetation levels are classified in the moderate category. This
species richness index for Malayan tapir forage indicates that
forage is still widely distributed and accessible, making it easy
for Malayan tapirs to fulfill their dietary needs. Species richness
can be determined by the quantity of species in the community. The
division of the number of species by the natural logarithmic
function of the Margalef richness index shows that the increase in
the quantity of species is inversely proportional to the quantity of
individuals (Baderan
et al. 2021).
3)
Distribution
of Malayan tapir forage
There
are three distribution patterns, which include clumped, uniform, and
random. Among the identified Malayan tapir forage, fourteen species
exhibited a random category, twelve exhibited a clumped category,
and seven exhibited an undefined value. The distribution patterns of
Malayan tapir forage species are presented in Table 5.
Table
5.
The distribution patterns of Malayan tapir forage species
Vernacular
name
|
Morisita
index (%)
|
Distribution
pattern
|
Cincauan
|
0
|
-
|
Alang-alang
|
1.23
|
Clumped
|
Bayur
|
1.23
|
Clumped
|
Berasan
|
1.02
|
Clumped
|
Blimbingan
|
0.93
|
Random
|
Mundu
|
0
|
-
|
Gaharu
|
0.93
|
Random
|
Jambon
|
1.20
|
Clumped
|
Kalopo
|
1.08
|
Clumped
|
Karetan
|
0
|
-
|
Keladi
|
0
|
-
|
Kelandri
|
1.04
|
Clumped
|
Ki
teja
|
0.76
|
Random
|
Kopian
|
4.17
|
Clumped
|
Krakas
|
1.07
|
Clumped
|
Laban
|
0.93
|
Random
|
Medang
|
0
|
-
|
Meniran
|
0.50
|
Random
|
Paku
hata
|
0.50
|
Random
|
Paku
rambat
|
0.87
|
Random
|
Pelangas
|
0.54
|
Random
|
Pulai
|
0
|
-
|
Rambutan
|
0.98
|
Random
|
Rumput
gajah
|
1.47
|
Clumped
|
Rumput
paitan
|
1.33
|
Clumped
|
Rumput
teki
|
0.67
|
Random
|
Salam
|
0.33
|
Random
|
Sempu
air
|
0.50
|
Random
|
Senggani
|
1.16
|
Clumped
|
Soka
|
1.48
|
Clumped
|
Sulangkar
|
0.81
|
Random
|
Tiga
urat
|
0.90
|
Random
|
Waru
|
0
|
-
|
Clumped
distribution patterns are often driven by the reproductive
mechanisms of plants spreading in the surrounding area. Clumped
distribution occurs due to habitat traits that have similarities and
factors that support the development of plants. In addition, an
organism's response to habitat differences and weather changes due
to the regeneration process can lead to individual groupings
(Setiarno
et al. 2025).
Competition among individuals or species resulting from clumped
patterns may intensify in the acquisition of food resources such as
nutrients, space, and light. A factor that plays a significant role
in determining distribution patterns is the physical condition of
the environment (Abdullah
2023).
Random distribution can occur as a result of homogeneous
environments or behaviors that do not require special resources or
can be referred to as generalist species (Setiarno
et al. 2025).
There are undefined values for some plant species, such as pulai,
karetan,
and medang,
because these plant species were encountered as single individuals
only a single sampling plot. The predominantly clumped distribution
of forage makes it easier for Malayan tapirs to find forage.
4)
Dietary
Nutritional Content
The
first step in determining the nutritional content of Malayan tapir
forage is to collect samples. The nutritional content of the forage
is tested using proximate analysis. The frequency of Malayan tapir
forage based on feeding traces on transect in rawa bunder resort are
shown in table 6.
Table
6.
The
frequency of Malayan tapir forage based on feeding traces on
transect in rawa bunder resort
Vernacular
name
|
Scientific
name
|
Frequency
(%)
|
Berasan
|
Symplocos
stenosepala
|
46.15
|
Senggani
|
Melastoma
malabathricum
|
30.77
|
Gaharu
|
Aquilaria
malaccensis
|
19.23
|
Krakas
|
Helicia
sp
|
19.23
|
Jambon
|
Syzygium
sp.
|
11.54
|
Soka
|
Ixora
sp.
|
3.85
|
Tiga
urat
|
Neolitsea
zeylanica
|
3.85
|
Teluntum
|
Lumnitzera
racemosa
|
3.85
|
The
results of the proximate analysis of Malayan tapir forage, namely
berasan
(Symlocos
stenosipala),
pulai (Alstonia
scholaris),
krakas
(Helicia
sp.),
gaharu
(Aquilaria
malaccensis),
and senggani
(Melastoma
malabathricum),
are shown in Table 7. Samples of 5 types of plants were taken as
much as 0.5 kg for proxy analysis. The results of this proximate
analysis are sufficient to describe the nutritional content and do
not need further tests because tests are carried out by experts.
Table
7.
Nutritional content of selected Malayan tapir forage
Vernacular
name
|
Scientific
name
|
Nutritional
content (%)
|
DM
|
WC
|
Ash
|
CP
|
CFi
|
CF
|
NFE
|
Berasan
|
Symplocos
stenosipala
|
85.28
|
14.72
|
16.16
|
10.20
|
21.99
|
3.10
|
33.83
|
Gaharu
|
Aquilaria
malaccensis
|
86.69
|
13.31
|
7.50
|
9.71
|
33.86
|
2.57
|
33.05
|
Krakas
|
Helicia
sp.
|
80.02
|
19.98
|
15.73
|
8.38
|
23.69
|
1.27
|
30.95
|
Pulai
|
Alstonia
scholaris
|
84.70
|
15,30
|
22.15
|
9.15
|
31.09
|
3.33
|
18.98
|
Senggani
|
Melastoma
malabathricum
|
81.32
|
18.68
|
9.36
|
13.82
|
24.02
|
1.97
|
32.15
|
Remarks:
DM = dry matter; WC = Water Content; CFi = Crude Fiber; CF = Crude
fat; CP = Crude Protein; NFE = Nitrogen Free Extract
The
results of the analysis in Table 7 show that the percentage values
of the nutrient content in the five species of Malayan tapir forage
plants vary greatly. The dry matter content of the forage samples
ranged from 80.02% to 86.69%. The moisture content ranged from
13.31% to 19.98%. The ash content ranged from 7.50% to 22.15%. The
crude protein percentage ranges from 8.38% to 13.82%. Crude fiber
ranges from 21.99% to 33.86%. Crude fat ranges from 1.27% to 3.33%.
The Nitrogen Free Extract (NFE) content ranges from 18.98% to
33.83%. Dry matter has an average of 83.6% with the lowest
percentage being in krakas
with a value of 80.02%. Meanwhile, krakas
has the lowest percentage of crude fat at 1.27%.
The
dry matter in plants is influenced by the organic content and the
moisture content in the forage material. This is in line with the
statement of Dzulhidayat
(2022)
that the dry matter produced by forage materials is influenced by
the water content in the forage materials and the addition of water
during forage material processing. The fresher the forage
ingredients used, the higher the moisture content, and if the forage
ingredients are first wilted, the moisture content will be lower
(Hediawan
et al. 2024).
Ash content is a mixture of minerals contained in a material so that
it can indicate the total minerals in a material (Haq et al. 2018).
Minerals have an important role as tissue growth and repair, bone
and tooth formation, hair, nails, and horn formation needed by
wildlife. The amount of ash in animal forage can determine the
calculation of Nitrogen-Free Extract (Hombing
et al. 2018).
The highest ash content in Malayan tapir forage is found in pulai,
which is 22.15%. However, pulai
has a fairly low crude protein content of 9.15%. In contrast,
senggani
has the highest protein content with a percentage of 13.82%. Crude
protein has a nitrogen content that generally ranges from 10%.
Protein has an important role in determining diet quality for
non-ruminant animals (Putri
et al. 2025).
The difference in crude protein content can be attributed to the age
of the plant and the dry matter of the forage (Ismul
& Mustari 2020).
The
crude fiber content in berasan,
krakas,
and senggani
has a lower percentage compared to gaharu
and pulai,
which are 21.99%, 23.69%, and 24.02%. The crude fiber content can be
determined by the age of the forage. Inversely proportional to the
others. The smaller the fiber, the more preferred it is by Malayan
tapirs. According to Datta
(2023),
the characteristics of the fiber in crude fiber make most of it
difficult for animals to digest, especially monogastric animals.
Forage with lower crude fiber content can accelerate the rate of
forage passage and Malayan tapirs do not need to expend a lot of
energy to digest food (Simpson
et al. 2013).
The crude fat content has an average of 2.448%, with the highest
percentage being found in pulai
at 3.33%. Crude fat affects the body fat of Malayan tapirs. This is
in line with the statement of Lapui
et al. (2021)
that the consumption of forage with low fat causes higher-fat forage
increases adipose storage. Conversely, if the consumption of forage
with high fat causes the fat in the body of livestock to also be
high, this affects livestock products. Fat is very important to
maintain the stability of the body's condition so that it remains
healthy during unfavorable seasons. Berasan
has the highest Nitrogen-Free Extract (NFE), which is 33.83% and
pulai
has the lowest NFE, which is 18.98%. NFE is a component of forage
ingredients that contains carbohydrates, sugars, and starch. NFE can
determine the level of ease of digestibility of diet by animals. The
higher the NFE value, the higher the digestibility rate of a type of
forage (Hombing
et al. 2018).
5)
Aspects
of Conservation
The
abundance of forage is beneficial for the Malayan tapir’s habitat.
However, proper management is also needed to preserve this forage
supply. Numerous threats, such as forest fires, can destroy their
food sources. Changes in land use or zoning within WKNP also affect
Malayan tapir habitat conditions. The extensive areas of cogon grass
and shrub still found in WKNP need to be restored to expand the
Malayan tapir foraging areas. It is necessary to strengthen in
carrying out conservation activities such as habitat restoration
that prioritizes the enrichment of planting in shrub areas using
types of tapir feed and types of trees that can be used by tapirs as
a resting place. Planting of fruit trees also needs to be done to
increase the availability of feed while supporting the ecological
role of tapir as a seed transmitter.
Malayan
tapirs effectively discovered at forest edges, probably need to
require monitoring to ensure their continued presence. Forest edges
with high levels of human activity certainly pose a threat to the
Malayan tapirs’ survival. Monitoring strategies that can be
carried out are in the form of public patrols or the installation of
camera traps on paths indicated as tapir habitats, especially those
adjacent to places of human activity.
4.
Conclusion
The
composition of the Malayan tapir forage at Rawa Bunder Resort, Way
Kambas National Park, was successfully identified as 33 species from
25 families, with a dominance of growth form is tree. The IVI shows
that alang-alang
(Imperata
cylindrica)
dominates at the level of undergrowth, and berasan
(Symplocos
stenosepala)
dominates at the level of saplings, poles, and trees. The results of
diversity and richness indices are moderate and an evenness index is
high indicate except undergrowth layer that the availability of
Malayan tapir forage is fairly well maintained. The distribution
pattern of Malayan tapir forage was dominated by random, also
supports the capability of forage availability. Senggani
and berasan
are the forages most frequently consumed by Malayan tapirs in the
field, with the frequency of finding forage remains being 30.77% and
46.15%. The proximate test results show that the nutritional content
of the forage varies greatly, with senggani
providing the highest protein at 13.82% and berasan
having the lowest crude fiber at 21.99%, which is ideal for the
single-stomach digestive system (hindgut fermenter) of the Malayan
tapir.
5.
Author
Contributions
Experimental
design was designed by first author (JIN) and Second author (AHM).
The implementation of the experiment was carried out by the first
author (JIN). The data is interpreted by the first author (JIN) and
assisted by the Second author (AHM) in refining it. The preparation
of the article is carried out by first author (JIN) with the
guidance of the Second author (AHM).
6.
Competing
Interests
The
author conducted this research as an interest in the thesis
7.
Acknowledgements
Thanks
to my parents who support the author about finance and mentality.
This research was supported by Way Kambas National Park. We are most
grateful to pak Heri Susanto, pak Amrodi, forest police, SPRB staff,
who has helped us for assisting in the field. We also thank the
staff of the Way Kambas National Park, pak Saepul, and pak Willy for
giving us the data. Thanks to staff of feed science and technology
laboratory, mba ratih and pak dadang, for helping the Malayan tapir
diet nutrition testing.
8.
References
Abdullah,
S., Tolangara, A. R., & Ahmad, H. (2023). Studi Jenis dan Pola
Sebaran Tumbuhan Lamun di Perairan Desa Teluk Buli Kecamatan Maba.
Jurnal Bioedukasi, 6(1), 197-204.
https://doi.org/10.33387/bioedu.v6i1.4402
Anwar,
M. K., Yoza, D., & Darlis, V. V. (2023). Characteristics of the
Asian Tapir (Tapirus indicus) Habitat in the Working Area of the
Lahai Resort SPTN II Belilas Bukit Tiga Puluh National Park and
Surroundings in Riau Province. Jurnal Ilmu Ilmu Kehutanan, 7(1),
30-38. https://doi.org/10.31258/jiik.7.1.30-38
Baderan,
D. W. K., Rahim, S., Angio, M., & Salim, A. I. B. (2021).
Keanekaragaman, Kemerataan, dan Kekayaan Spesies Tumbuhan dari
Geosite Potensial Benteng Otanaha sebagai Rintisan Pengembangan
Geopark Provinsi Gorontalo. Al-Kauniyah: Jurnal Biologi, 14(2),
264-274. https://doi.org/10.15408/kauniyah.v14i2.16746
Damayanti,
D. R. (2016). Permudaan Alami Hutan di Satuan Pengelolaan Taman
Nasional (SPTN) Wilayah III Kuala Penet Taman Nasional Way Kambas.
http://digilib.unila.ac.id/id/eprint/23543
Datta,
F. U. (2023). Dasar Ilmu Nutrisi dan Pakan Hewan. Deepublish.,
Yogyakarta.
Dzulhidayat,
D. (2022). Characteristics Of Elephant Grass Silage (Pennisetum
purpureum) using Lactic Acid Bacteria Inoculator from Rumen Fluids
(Doctoral dissertation, Universitas Hasanuddin).
http://repository.unhas.ac.id:443/id/eprint/19186
Hediawan,
F., Cakra, I. G. L. O., & Trisnadewi, A. A. A. S. (2024).
Kandungan Nutrien Silase Rumput Gajah (Pennisetum purpureum) dengan
Penambahan Tepung Daun Gamal (Gliricidia sepium) pada Level Berbeda.
Pastura: Jurnal Ilmu Tumbuhan Pakan Ternak, 14(1), 45-51.
https://garuda.kemdiktisaintek.go.id/documents/detail/5972239
Hombing,
J. B., Dewi, B. S., Tantalo, S., & Harianto, S. P. (2018). Study
of Nutrition Content Food Drop in Deer in PT. Gunung Madu
Plantations. Jurnal Sylva Lestari, 6(1), 32-38.
https://doi.org/10.23960/jsl1633-39
Ismul,
M., & Mustari, A. H. (2020). Jenis, Penyebaran, dan Kandungan
Nutrisi Pakan Anoa (Bubalus sp.) di Taman Nasional Gandang Dewata,
Sulawesi Barat.
https://agris.fao.org/search/en/providers/122323/records/65a9450e48e16287cfb9df17
Krebs,
C. J. (1989). Ecological methodology. Harper Collins Publishers,
Inc., New York.
Kusmana,
C. (1997). Metode survey vegetasi. Pt. Penerbit Insitut Pertanian.,
Bogor.
Laia
F. 2021 Mei 14. Data ilmiah tapir di indonesia minim, konservasinya
bagaimana?. Belahita. Konservasi. [diakses 2026 Jan 10].
https://betahita.id/news/detail/6190/data-ilmiah-tapir-di-indonesia-minim-konservasinya-bagaimana-.html?v=1621268313
Lapui,
A. R., Nopriani, U., & Mongi, H. (2021). Analisis Kandungan
Nutrisi Tepung Jagung (Zea mays Lam) dari Desa Uedele Kecamatan Tojo
Kabupaten Tojo Una-Una untuk pakan Ternak. Agropet, 18(2), 42-46.
Magurran,
A.F. (2004). Measuring biological diversity. Blackwell Publishing
Company., United Kingdom.
Maharani,
N. D., Harianto, S. P., Iswandaru, D., & Winarno, G. D. (2019).
Sebaran jenis pakan tapir (Tapirus indicus, desmarest, 1819) di
taman nasional way kambas (tnwk).
http://repository.lppm.unila.ac.id/id/eprint/11771
Putri,
D. K., Murnisari, Y., Madalena, D. K., Setiarini, N., Diputri, R. L.
D., Suryanda, A., & Azrai, E. P. (2024). Keanekaragaman Tumbuhan
Bawah di Kawasan Universitas Negeri Jakarta. Panthera: Jurnal Ilmiah
Pendidikan Sains dan Terapan, 4(1), 10-17.
https://doi.org/10.36312/panthera.v4i1.228
Putri,
S. E., Abdullah, F. M., Septiyaningsih, R., Aulia, F., & Rahayu,
T. P. (2025). Nutrisi Seimbang untuk Unggas: Memahami Pentingnya
Protein dan Serat: Balanced Nutrition for Poultry: Understanding the
Importance of Protein and Fiber. Jurnal Ilmiah Ilmu-Ilmu Peternakan,
28(1), 1-11. https://doi.org/10.22437/jiiip.v28i1.35982
Samantha,
L. D., Tee, S. L., Kamarudin, N., Lechner, A. M., & Azhar, B.
(2020). Assessing Habitat Requirements of Asian Tapir in Forestry
Landscapes: Implications for Conservation. Global Ecology and
Conservation, 23. https://doi.org/10.1016/j.gecco.2020.e01137
Setiarno,
S., Nababan, S. R. T., Hidayat, N., Rotinsulu, J.M., & Junaedi,
A. (2025). Komposisi Vegetasi, Keanekaragaman Jenis, dan Pola
Dispersi Tumbuhan Langka pada Kawasan Laboratorium Alam Lahan Gambut
Universitas Palangka Raya. Hutan Tropika, 20(1), 165-174.
https://doi.org/10.36873/jht.v20i1.20219
Simpson,
B. K., Shukor, M. N., & Magintan, D. (2013, Nov). Food selection
of the Malayan tapir (Tapirus indicus) under semi-wild conditions.
In AIP conference proceedings (Vol. 1571, No. 1, pp. 317-324).
American Institute of Physics.
https://pubs.aip.org/aip/acp/article-abstract/1571/1/317/880344
Sjahfirdi,
L., & Ananda, S. D. (2023). Perilaku Maternal dan Kesejahteraan
Tapir Asia (Tapirus Indicus) Di Taman Margasatwa Ragunan. Jurnal
Al-Azhar Indonesia Seri Sains dan Teknologi, 8(2), 154-161.
http://dx.doi.org/10.36722/sst.v8i2.1655
Williams,
K. D., & Petrides, G. A. (1980). Browse Use, Feeding Behavior,
and Management of the Malayan Tapir. The Journal of Wildlife
Management, 44(2), 489-494. https://doi.org/10.2307/3807985
Yunus,
M., Alim, N., Sumianto, A. S., & Subagyo, A. (2019, May).
Keragaman dan distribusi mammalia di Taman Nasional Way Kambas,
Sumatra Indonesia. In Prosiding Seminar Nasional Sains, Matematika,
Informatika dan Aplikasinya (Vol. 4, No. 2, pp. 31-42). Fakultas
MIPA Universitas Lampung.
https://rhinoresourcecenter.com/wp-content/uploads/2019/07/1562852255.pdf